Hi All
Been a while since i posted a chart update.
View attachment 13555
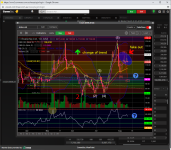
Sub wave 1 complete, pretty impressive movement from 80 - 134 ( 2.618 fib movement ) 65% appreciation, so it was only natural that profit taking would occur thereafter, what goes up vertical goes down vertical.
What normally happens after a sub wave 1 movement is a ABC correction sub wave 2 down movement, so in this case, A has been complete, with B following suit, then C normally completes the cycle.
Yellow arrow pointing to a bearish shooting star candle, normally pops up in a uptrend, so that could be the precursor for the C movement, conversely, if a clear break to the upside of resistance at 113/ 115 occurs, then sub wave 2 is done and dusted and sub wave 3 up follows.
Thats the theory according to Elliot Wave formation.
MACRO wise, next week could be a bit challenging.....
View attachment 13557
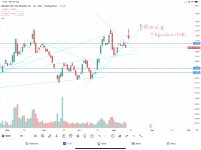
DOW facing head winds with a strong resistance zone required to be punched thru, blue bubble and RSI 14 suggesting a pull back might be on the cards as its looking rather toppy.
View attachment 13558
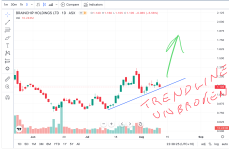
Regards to the NASDAQ, minor sub wave 3 up has hit the 1.618 target of 12648, RSI 14 is a bees dick away from reaching over bought 70 and there is head wind resistance where it currently lies plus further resistance at 12975.
So MACRO forces may not be in BRN favour come next week.
I bought my first parcel at 1.03 and i will wait to see how next week transpires before i add more.
All IMO< IMO< IMO