Technical Analysis

manny100

Regular
We have just seen an 'old timers' 3 bar buy daily signal today as a follow up to the weekly bullish set up.
The MACD Divergence which is playing out as we speak adds a little spice to the signal.
Will be interesting to see whether it plays out. Bullish pressure indicators suggest we may well see a rally from here. Volume only average today. Tomorow will be interesting.
Its been building for 4/5 weeks or so and could not have been more obvious.
I notice BRN have been stepping up their marketing since early April including Investor Presentations. Connected??
Wait and see as no sure things in markets.
DYOR
 

Attachments

  • BRN 11TH MAY23.png
    BRN 11TH MAY23.png
    12.6 KB · Views: 70
  • Like
  • Fire
Reactions: 15 users

manny100

Regular
Posted this on HC. Did not attach a chart. Post charts that look bullish and you get shat on from a great height on HC.
Still the likely rally we may see has been obvious for many weeks.
"Hmmm, we have just seen an 'old timers' 3 bar buy daily signal today as a follow up to the weekly bullish set up.
The MACD Divergence which is playing out as we speak adds a little spice.
Tomorow will be very interesting as the recent price action will not go unnoticed.
DYOR. Markets are unpredictable."
 
  • Like
  • Love
  • Haha
Reactions: 6 users
Whilst still downside risk given the overall long term trend there are some positive analysis starting to appear to the upside.

The downside predictions are a little hedged imo however these guys have stated that prediction model can be broken by some sustained positive movements next several days.

Overall a buy candidate now.

Screenshot_2023-05-11-21-49-56-53_e2d5b3f32b79de1d45acd1fad96fbb0f.jpg
 
  • Like
  • Fire
Reactions: 11 users
D

Deleted member 118

Guest
The borrowing rate for BRN shorts has decreased by 50% since the ARM tech talk which is interesting, as didn’t someone mention before when I posted previously, the higher the interest rate the higher the risk for the lender, which says to me that talk may have de risked us substantially.

7CF42BB0-E9E4-47C5-BA2E-374D37ABDF46.png
 
Last edited by a moderator:
  • Like
Reactions: 4 users
D

Deleted member 118

Guest
I might be wrong but I believe it's based on volatility as well as qty of short positions. I'm guessing QAN has a fraction of the volatility, by percentage.
This was the post so I guess dropping 50% is a good sign.
 

charles2

Regular
This was the post so I guess dropping 50% is a good sign.
Less demand to borrow stock to short. Therefore interest rate goes down as the supply is better. Why is the supply better....mainly because shorts have started to cover.

Hope this helps.
 
  • Like
  • Love
Reactions: 10 users
D

Deleted member 118

Guest
Less demand to borrow stock to short. Therefore interest rate goes down as the supply is better. Why is the supply better....mainly because shorts have started to cover.

Hope this helps.
But the shorts were increasing. So it be good to see the amount still outstanding to date to see if its correct
C66E05B2-DA77-45B0-A187-63E8BB2D8FBD.png
 
  • Like
Reactions: 3 users

charles2

Regular
But the shorts were increasing. So it be good to see the amount still outstanding to date to see if its correct View attachment 36309
Might have a million short sales in a day but if 1.2million cover then there are more shares available to short so one does not have to pay as much to entice stockholders to lend their shares if this trend continues.

It is a simple concept.....if there are plentiful shares to borrow then one doesn't have to pay so much to borrow them,

If the rate goes down shares are being covered in excess of shorting new shares.

(I suppose an exception might be if a large shareholder was suddenly willing to lend and previously had not been....But big shareholders are usually institutions and they lend to enhance income as a matter of course)
 
  • Like
Reactions: 5 users

manny100

Regular
Whilst still downside risk given the overall long term trend there are some positive analysis starting to appear to the upside.

The downside predictions are a little hedged imo however these guys have stated that prediction model can be broken by some sustained positive movements next several days.

Overall a buy candidate now.

View attachment 36306
Shorts peaked in March and have fallen back a bit since. After the peak the SP kept falling while the MACD started rising.
A MACD bullish divergence is now playing out.
How far it takes us? With luck far enough to cause a rethink about the LT downtrend as mentioned in the report.
There certainly has been an increase in buying pressure over the last 5 or so weeks. Sneaky accumulation.
Buying pressure/selling pressure can be very infectious.
We will have a fair idea where its going by Friday COB.
BRN news of late has been encouraging.
 
  • Like
Reactions: 12 users

BEISHA

Top 20
Hi All

Its been a real long time since i posted a chart here, a combination of me being super busy at work plus with the bearish nature of BRN, havnt really found a reason to post a chart.........until now.

I thought i would start with the long term chart of BRN , then work my down to the daily and even the hourly.

View attachment 33862

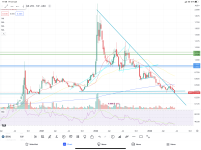
Folks might remember this chart when i first posted here, i mentioned back then BRN completed a full set of 5 waves, a super cycle so to speak, the next wave to follow was sub wave 2 down, which can go down rather deep,

Given the vertical nature of the sub wave 5 up and RSI 14 reaching a lofty 87, with no support zones on the way down until 60, wave 2 down was always going to have a decent descent..

For a while there, 60 support was looking good to hold, then MACRO turned shit and sales were disappointing, so SP drifted to the next level of support at 39/50.........it got to a low of 40.5.

If we observe the RSI 14 now, it looks to be levelling out........has BRN seen the low ?


WEEKLY CHART


View attachment 33871

3 green bubbles starting from the top.

a) SP looks to be forming a base

b) MACD......green line converging with red signal line, we need to see that break above to confirm bullish

c) RSI 14 hit over sold 30 and is now slightly rising.

More evidence that 40.5 may be the low.


DAILY CHART

View attachment 33872


MACD has turned bullish

RSI 14 needs to break up from the bearish trend line but has noticeably got off the canvas..

SP showing some higher highs but needs to break up from the 21 ema and break to the upside of that white bearish trend line to confirm BULL


HOURLY CHART

View attachment 33873 Well finally the trend is looking much better, with SP displaying clear higher highs / lows.

MACD looks set to break out.

RSI 14 displaying a bullish trend.

Minor sub wave 5 up looks good to go with strong support zone at 43/45.


Lets see what next week delivers and whether or not it confirms my instinct that BRN has finally seen the low.


As always, IMO, IMO, IMO


Have a good easter everyone !
Hi All

Well, looks like my instincts of a reversal in my previous post was just another fake out unfortunately...............:unsure::cautious:

Another 20% drop.......

missed it by that much.gif


Can i have another crack ?

DAILY CHART

1683982933167.png

Yellow arrow pointing to a big bullish hammer candle coming off the 35 low , with corresponding higher than average volume, since then , creating some nice methodical higher lows / highs.

MACD is bullish

RSI 14 trend is bullish with plenty of room to move.

If minor sub wave 5 up can push past that 45.5 / 47.5 resistance zone, then finally BRN may have a change of trend on its hands......🙏🙏🙏

imo
 
  • Like
  • Love
  • Fire
Reactions: 15 users

buena suerte :-)

BOB Bank of Brainchip
Hi All

Well, looks like my instincts of a reversal in my previous post was just another fake out unfortunately...............:unsure::cautious:

Another 20% drop.......

View attachment 36388

Can i have another crack ?

DAILY CHART

View attachment 36392
Yellow arrow pointing to a big bullish hammer candle coming off the 35 low , with corresponding higher than average volume, since then , creating some nice methodical higher lows / highs.

MACD is bullish

RSI 14 trend is bullish with plenty of room to move.

If minor sub wave 5 up can push past that 45.5 / 47.5 resistance zone, then finally BRN may have a change of trend on its hands......🙏🙏🙏

imo
Thanks for posting @BEISHA ... Hoping you are correct ... We could all do with BRN continuing 'The Green run' !! ⬆️🤞🙏🤞:cool:

"If minor sub wave 5 up can push past that 45.5 / 47.5 resistance zone, then finally BRN may have a change of trend on its hands"......🙏🙏🙏
 
  • Like
  • Fire
Reactions: 6 users
D

Deleted member 118

Guest
  • Like
Reactions: 5 users

Kachoo

Regular
Someone took out 2 lots of shorts earlier totalling 165,000 not surprised with the drop in the sp just a while ago

View attachment 36461


As you can see the day the shorts are taking out is normally when the price drops.

In my opinion playing short now on brainchip is like buying BRN at 2.00 plus in the FOMO.

Your chasing what has happened on the past. What will happen 6 months from now 1 or 2 years? That us what you should be focusing on ? IMO

That said many games cam be played out buy brokerages to accumulate shares like they have been.

I'm sure lots have grown in the towel at these prices.

My view is valuing BRN say back in late Dec 2020 what was the price?

What has been accomplished scince then to date may 2023?

Now how has the company changed on respect to growth? More people more partners. There was no talk about partnerships then with the ones we are with today?

Are Revenue has actually grown Year over year 2021 to 2022 read the financials. I will obviously say it's not huge but the movement of the company has really grown.

So with a that has happened if I was a buyer at 40 cents back then would I buy today absolutely that is my role opinion. Buffet does say people never like to buy stocks on sale only when there is a bidding war going on.

Just my thoughts

PS I know I know revenue. But let's face the last component of success is revenue.

You know I read an article that Alphabet jumped a small fraction of 81 billion dollars on AI news.
 
  • Like
  • Fire
Reactions: 10 users
In my opinion playing short now on brainchip is like buying BRN at 2.00 plus in the FOMO.

Your chasing what has happened on the past. What will happen 6 months from now 1 or 2 years? That us what you should be focusing on ? IMO

That said many games cam be played out buy brokerages to accumulate shares like they have been.

I'm sure lots have grown in the towel at these prices.

My view is valuing BRN say back in late Dec 2020 what was the price?

What has been accomplished scince then to date may 2023?

Now how has the company changed on respect to growth? More people more partners. There was no talk about partnerships then with the ones we are with today?

Are Revenue has actually grown Year over year 2021 to 2022 read the financials. I will obviously say it's not huge but the movement of the company has really grown.

So with a that has happened if I was a buyer at 40 cents back then would I buy today absolutely that is my role opinion. Buffet does say people never like to buy stocks on sale only when there is a bidding war going on.

Just my thoughts

PS I know I know revenue. But let's face the last component of success is revenue.

You know I read an article that Alphabet jumped a small fraction of 81 billion dollars on AI news.
Holding short O/N BRN as a sole trade is dangerous no doubt. Today a perfect intra day short at the 50 from open at 45.5, and re-breaching the 20 at 42.8 was also another short signal..

I'm using this simple data as a guide for scaling in or out. Not shorting as it's not my thing but just want to manage risk appropriately, particularly psychological capital.

1684121213734.png


Compare it to the reversal in 2021-2022, the 20EMA and 50 EMA start moving up vs currently moving down.

1684121449134.png


90-100% move followed by another 150% move.
Lead up time before each move:
-3 weeks, 2 weeks, 2 weeks, 4 weeks..
Ample time.

1684122084898.png
 
  • Like
Reactions: 5 users

Bombersfan

Regular
I’m very much an FA person but can someone with TA skills advise if we hold above .40 here again that will mean we’ve had 3 relatively evenly spaced bounces off .40ish the last 2 months does that constitute a triple bottom? I don’t know much TA but a triple bottom at the end of a sustained downtrend is very bullish. I understand a triple bottom doesn’t have to be the exact same number, we’ve hit .41, .385 and .405 23/3, 26/4 and 25/5 creating an ‘M’shaped chart. Blow me out of the water if I’m wrong.
We def need some material FA to go with it but a trend change would be most welcome.
 
  • Like
  • Fire
Reactions: 5 users

BEISHA

Top 20
I’m very much an FA person but can someone with TA skills advise if we hold above .40 here again that will mean we’ve had 3 relatively evenly spaced bounces off .40ish the last 2 months does that constitute a triple bottom? I don’t know much TA but a triple bottom at the end of a sustained downtrend is very bullish. I understand a triple bottom doesn’t have to be the exact same number, we’ve hit .41, .385 and .405 23/3, 26/4 and 25/5 creating an ‘M’shaped chart. Blow me out of the water if I’m wrong.
We def need some material FA to go with it but a trend change would be most welcome.
1685177825575.png

@MoneyBags1348

I have counted 8 touches coming off 39/40 support, so unless MACRO shites itself , or BRN disappoints the markets again with lacklustre sales or worse, then i see 40 as the base.

From a EW perspective, i got the count as minor sub wave 4 down, with sub wave 3 up failing to breach the minor resistance zone highlighted in red , the yellow arrow pointing to a bullish harami heiken ashi candle pattern , which could be the pivot for sub wave 5 up, which should break that minor 44/49 resistance zone and go as high as the start of the major resistance zone at 61, therein confirming a change of trend.

For that equation to happen , some positive sales news or a continued bullish trend from the NASDAQ will be required.


imo
 
  • Like
  • Fire
Reactions: 11 users
We all know, even those who aren't TA inclined, the SP has volatility, trends & movements up and down like all stocks.

In smaller windows we can see various TA patterns, potential, failed & confirmed, whilst I'm also interested in this possible wider view pattern currently evolving off the longer term downtrend.

The SP will need to hold around these levels & start its gradual rise to stay within the pattern of a rounding bottom. Some other indicators reflect a possible ranging & a smaller pattern at the mo (broadening wedge) can be bearish if breaks to the downside, so will know more early next week I suspect.

Couple of diff charts below. One a daily with the rounding bottom, a weekly with the same possible pattern and a daily with some other smaller patterns within as mentioned above.

What Is a Rounding Bottom?​

A rounding bottom is a chart pattern used in technical analysis and is identified by a series of price movements that graphically form the shape of a "U". Rounding bottoms are found at the end of extended downward trends and signify a reversal in long-term price movements. This pattern's time frame can vary from several weeks to several months and is deemed by many traders as a rare occurrence. Ideally, volume and price will move in tandem, where volume confirms the price action.


1686141334750.png


1686141389911.png


1686141665341.png
 
Last edited:
  • Like
  • Fire
  • Love
Reactions: 12 users
D

Deleted member 118

Guest
  • Like
Reactions: 1 users
Top Bottom