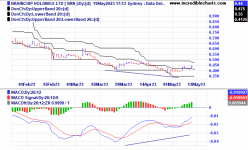
Technical Analysis

db1969oz

Regular
As I see it db, the support you're seeing is around 50cents with a couple of tests recently (imo), however, yesterday we left a gap from 50c to 54c on good volume. Compared to yesterday, the volume today is rather low on a red day, and it's a good thing. Sometimes this is seen as support at 54 cents (open price of a news related gap up, good volume, green day).

I personally wouldn't top up until I see a Higher Highs (on good volume) and then Lows (on low volume) on any stock these days, but if I am dollar cost averaging, it doesn't matter, these prices are bargain for a long term hold (My personal opinion, not to be taken as financial advice) with appropriate risk management.

In a couple of hours they decide on the interest rates too, will have to see how market reacts.
Cheers
 
  • Like
Reactions: 1 users

BaconLover

Founding Member
Can I add though, a lot of shares will sometimes break support momentarily, take out the stop losses and go up.
If you go through a few random charts you will be able to see this phenomenon, and happens across the board.

So just because it breaches support doesn't mean it is a real break, easier to check closing prices on daily chart, or even better, use weekly charts to have a clearer picture.
 
  • Like
  • Fire
  • Love
Reactions: 6 users

stuart888

Regular
Nenrustor.ai, new to me. Interesting is the 17 Brainchip mentions.

I have no idea if this is solid.


1678244807101.png
 
  • Like
  • Love
  • Thinking
Reactions: 3 users

BaconLover

Founding Member
Screenshot_20230321-144149_IG Trading~2.jpg


Ill Be Back Jim Carrey GIF
 
  • Like
  • Haha
Reactions: 6 users

BEISHA

Top 20
Hi All

Its been a real long time since i posted a chart here, a combination of me being super busy at work plus with the bearish nature of BRN, havnt really found a reason to post a chart.........until now.

I thought i would start with the long term chart of BRN , then work my down to the daily and even the hourly.

1680872110967.png


Folks might remember this chart when i first posted here, i mentioned back then BRN completed a full set of 5 waves, a super cycle so to speak, the next wave to follow was sub wave 2 down, which can go down rather deep,

Given the vertical nature of the sub wave 5 up and RSI 14 reaching a lofty 87, with no support zones on the way down until 60, wave 2 down was always going to have a decent descent..

For a while there, 60 support was looking good to hold, then MACRO turned shit and sales were disappointing, so SP drifted to the next level of support at 39/50.........it got to a low of 40.5.

If we observe the RSI 14 now, it looks to be levelling out........has BRN seen the low ?


WEEKLY CHART


1680872876227.png

3 green bubbles starting from the top.

a) SP looks to be forming a base

b) MACD......green line converging with red signal line, we need to see that break above to confirm bullish

c) RSI 14 hit over sold 30 and is now slightly rising.

More evidence that 40.5 may be the low.


DAILY CHART

1680873407499.png


MACD has turned bullish

RSI 14 needs to break up from the bearish trend line but has noticeably got off the canvas..

SP showing some higher highs but needs to break up from the 21 ema and break to the upside of that white bearish trend line to confirm BULL


HOURLY CHART

1680874051944.png
Well finally the trend is looking much better, with SP displaying clear higher highs / lows.

MACD looks set to break out.

RSI 14 displaying a bullish trend.

Minor sub wave 5 up looks good to go with strong support zone at 43/45.


Lets see what next week delivers and whether or not it confirms my instinct that BRN has finally seen the low.


As always, IMO, IMO, IMO


Have a good easter everyone !
 
  • Like
  • Love
  • Wow
Reactions: 26 users

gilti

Regular
as we have now hit the 52 week low (now the 57 week low) twice are we now in a technical double bottom situation or is the fact we are still being manipulated to sh*t house overruling this
 
  • Like
Reactions: 1 users
D

Deleted member 118

Guest
More than usual shorts taken out last week up to Thursday. Someone must have been privy to the last 4C unless it was coincidental

8D99E610-7C5E-4F8B-AB63-3C2214E74ECD.png
 
  • Like
Reactions: 3 users
D

Deleted member 118

Guest
Fridays short numbers and a massive 4 million were taken out and massive numbers for the week
BBE5E3F0-F980-434F-B180-E727CB256696.png
 
  • Wow
  • Like
  • Love
Reactions: 5 users

Kachoo

Regular
Fridays short numbers and a massive 4 million were taken out and massive numbers for the week View attachment 35419
I can value these report but also don't find a huge value on the daily. They are dependant that they get reported by the shorter.

Example the other day it shows a short cover of 12million 22nd and today 13 million 24th shorted if you look at the volumes there was never even that many trades.

Nor the 4 million taken on Friday to kick in the stop losses I believe would have tipped it and then they likely covered and bought with the stops.
.
But it's evident that the shorted went hard pre C4 knowing the report was likely poor which it was
 
  • Like
Reactions: 3 users

db1969oz

Regular
I reckon they are banking on it heading down to the next previous support, around 32c I reckon. Once 37 was broken, and no news expected in the near future, I won’t be surprised if they can push it down to there! Mofos!
 
  • Like
Reactions: 2 users

Labsy

Regular
My technical analysis guys. You are welcome. If they are of value, I'll keep posting. If not let me know because it took ages of my time. Cheers.
Screenshot_20230502_142012_CMC Invest.jpg
 
  • Haha
  • Love
  • Like
Reactions: 18 users
D

Deleted member 118

Guest
  • Haha
  • Like
Reactions: 4 users
D

Deleted member 118

Guest
A massive drop in the amount of shares borrowed to short on Monday and I wonder if it’s just getting too expensive to borrow then with the apr upto 17% from 16% the previous week. I took a look at quanta’s borrowing rate and that stands at under 2% apr, does anyone know what they massive difference in borrowing rates? Or is it just quantas isn’t a risk stock like Brn currently? Or is it they can make more money from BRN than Quantas?
76D24302-343B-4AF7-8766-A7C0B18E2F54.png
EEB47622-AB30-4D3D-96D0-E148B7A79AA2.png
quanta’s borrowing rate

E9A88755-29F5-4AAD-B4EA-31C8D96D1ABB.png
 
  • Like
  • Fire
Reactions: 5 users

Damo4

Regular
A massive drop in the amount of shares borrowed to short on Monday and I wonder if it’s just getting too expensive to borrow then with the apr upto 17% from 16% the previous week. I took a look at quanta’s borrowing rate and that stands at under 2% apr, does anyone know what they massive difference in borrowing rates? Or is it just quantas isn’t a risk stock like Brn currently? Or is it they can make more money from BRN than Quantas? View attachment 35541 View attachment 35542 quanta’s borrowing rate

View attachment 35543

I might be wrong but I believe it's based on volatility as well as qty of short positions. I'm guessing QAN has a fraction of the volatility, by percentage.
 
  • Like
Reactions: 3 users

Labsy

Regular
Very low volume today so far... 🤔
 
  • Like
Reactions: 2 users
Are we there yet?

Very basic rules of investing in a company
  • SP Under 200MMA = Bear Market.​
  • SP Over 200MMA = Bull Market.​

Buy the trend for added confidence.
We are not there yet and there is a long way to go as BRN has traded under its 200MMA since August 2022.
I do see a glimmer of hope. It would need some news to fullfill though.
It would be fantastic for the conference, 9th May, by ARM demonstrating AKIDA capabilities to contain enough news or projections to support glimmer of hope.
The charts show a slight change in sentiment over the last 6 weeks.
MACD Positive Divergence

Would be extra nice for Sean to be able to discuss something really positive, at the AGM 2 weeks later, that may come from this conference.
If no news/announcment we should expect a continuation of the current SP decline.

The MACD even though it has been on very low trading volumes and the fact its a lagging indicator it seems to be hinting of a change in direction/sentiment.
The lowest MACD in the last 12 months has been -0.079 which occured in Novemeber 22
The SP has made new lows since but the MACD has not.
At the time of the darkest mood for the SP, May 2023 (37c), the MACD had not set a new low and stood at higher at -0.023
A positive sign things may be turning. Crossing everything and holding my breath.

1683523578373.png


  • Like
  • Love
  • Fire
Reactions: 16 users

manny100

Regular
Are we there yet?

Very basic rules of investing in a company
  • SP Under 200MMA = Bear Market.​
  • SP Over 200MMA = Bull Market.​

Buy the trend for added confidence.
We are not there yet and there is a long way to go as BRN has traded under its 200MMA since August 2022.
I do see a glimmer of hope. It would need some news to fullfill though.
It would be fantastic for the conference, 9th May, by ARM demonstrating AKIDA capabilities to contain enough news or projections to support glimmer of hope.
The charts show a slight change in sentiment over the last 6 weeks.
MACD Positive Divergence

Would be extra nice for Sean to be able to discuss something really positive, at the AGM 2 weeks later, that may come from this conference.
If no news/announcment we should expect a continuation of the current SP decline.

The MACD even though it has been on very low trading volumes and the fact its a lagging indicator it seems to be hinting of a change in direction/sentiment.
The lowest MACD in the last 12 months has been -0.079 which occured in Novemeber 22
The SP has made new lows since but the MACD has not.
At the time of the darkest mood for the SP, May 2023 (37c), the MACD had not set a new low and stood at higher at -0.023
A positive sign things may be turning. Crossing everything and holding my breath.

View attachment 35956

I noted the MACD bullish divergence Its playing out. Not so sure how far it will take us.
Long term MACh100,50,30 day shows the longer term trend running out of puff.
Weekly standard Chaiken oscillator also shows a bullish divergence. Its in bearish territory but moving up. It's reasonably rare to see it above zero in bullish territory.
Some sneaky accumulation.
I will post a chart when I get on my lap top.
We are still in a downtrend until we are not.
Some green bull shoots appearing. Just a little news will see it move.
I do not mind buying a good business when market sentiment is low. Leverage off low prices magnifying returns.
I rate BRN as a good stock.
 
  • Like
  • Fire
  • Love
Reactions: 11 users
D

Deleted member 118

Guest
Wow 2% up today wasn’t expecting that, maybe a push towards 50c is on the cards
 
  • Like
  • Fire
  • Love
Reactions: 6 users
Top Bottom