Fullmoonfever
Top 20
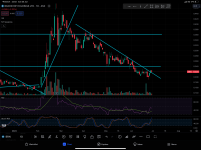
Needs support here or descending triangle could come into play.


Just a quick Ichimoku chart thought though I use other charts too for other indicators in conjunction with this one.
Always looks like a lot going on but the basics of Ichimoku are not too complex but won't get into it too much as not time at the mo.
Suffice to say the Kumo (cloud) has thinned which is good as provides less resist (thicker is more resist to get through or to consolidate within or reject). Kumo twist which is the bottom green line crossing the upper red line (Senkou A & B) indicates bullish or bearish (bearish still currently).
Flat tops have a habit of attracting price for retests if get a break out.
There are other nuances with Tenkan, Kijun & Chikou crosses, price crosses on them etc but won't get into now.
Mixed bag on the table summary hence the consolidation status at this point. Kumo BO & Twist strong bearish due to their current positions but won't take much to reverse those if a bit of solid price action continues.
Overall trhe current move is testing supply imo. We will see whether that overwhelms the buyers & we get a rejection to consolidate again before another attempt.
Genral rule of thumb is distribution occurs on large price runs cumlminating in a buying climax (Feb / Mar) then rolls over to reverse (downtrend) and accumulation occurs at the bottom till a selling climax (I get the feeling this may have been the action in Aug) then starts over again. This is how SM play the game.
View attachment 69937
In the interest of personal development, does this 3 candle formation mean the end of the run?Haven't had chance to review my normal charts on laptop but here is what I am watching for tomorrow from quick snip on phone.
The third candle (tomorrow's) will be important in this potential 3 candle pattern for failure or completion.
Today's chart:
View attachment 70308
What it could mean if completes:
View attachment 70309
Hi Flenton.In the interest of personal development, does this 3 candle formation mean the end of the run?

 www.livingfromtrading.com
So it finished flat as yesterday candle, @Fullmoonfever, what is your interpretation? Cheer.Haven't had chance to review my normal charts on laptop but here is what I am watching for tomorrow from quick snip on phone.
The third candle (tomorrow's) will be important in this potential 3 candle pattern for failure or completion.
Today's chart:
View attachment 70308
What it could mean if completes:
View attachment 70309

Hi Learning.So it finished flat as yesterday candle, @Fullmoonfever, what is your interpretation? Cheer.
View attachment 70364
Learning
whats the link for apple ? ThxMy inexperienced TA is showing very positive signs with my key indicators heading in the right direction.
This increase feels different to the others. It seems more controlled and there seems to be more mentions of Akida by connected people eg Senior Software cloud engineer at Apple (thanks amazing forum members for sharing your finds) and it feels like the tide is turning. My bones tell me something has started brewing.
I've been fooled by emotions before with Brainchip so it won't surprise me if I'm fooled again.
whats the link for apple ? Thx