You are using an out of date browser. It may not display this or other websites correctly.
You should upgrade or use an alternative browser.
You should upgrade or use an alternative browser.
Technical Analysis
- Thread starter Vojnovic
- Start date
D
Deleted member 118
Guest
Don’t you mean accumulatingNasdaq up 3.7% and BRCHF down 3.5%, albeit on low volume. Looks like the selling has not finished yet.
D
Deleted member 118
Guest
A shorter must be closing its position this morning.
Cyw
Regular
Where there is a seller, there is a buyer. Looking at the size of the trades, it is more a distribution pattern at this stage. I don't know why people are selling, perhaps they have made too much money already or some scare tactics to shake the tree.Don’t you mean accumulating
I hope there will be some positive announcements before the 4C. If the 4C shows $10M income, they would have to somehow explain it. If the 4C is mediocre then we will have to wait for the next quarter.
I think most people here expect large sales in the second half.
YLJ
Swing/Position Trader
Here are a few updates on my thinking & why I have been and still am indicating caution on near/medium-term price possibilities.
This is all the more relevant for traders who need to be very clear on their trade time-frames and stop-loss management. It is not BRN specific, but as mentioned before, I believe it is having a major effect and may well continue to do so.
The chart I posted in the quoted post was the Nasdaq 100 E-mini Futures. Price has just wicked off the area of the 50-week Bollinger bands
and the May 2021 lows (support). The daily H&S on E-mini Futures has not met its measured target, but the same pattern as it formed
on the actual Nasdaq 100 (NDX) & Nasdaq Composite Index (IXIC) did reach their targets, from which they have bounced up today.
It is theoretically possible we have seen a bottom, but IMHO the market is in a very delicate position. There are arguments for a much larger H&S weekly top being formed on some of the above-mentioned variations of charts on the Nasdaq (some more convincing than others & with slightly different implications). The more down-slanted neckline of the NDX vs the Horizontal one on the IXIC indicates that there is more concern about the large valuations (PE multiples and growth expectations) of the larger tech stocks. These patterns need to be resolved, but
the situation is intense. I do not see much of a chance of a quick return to previous highs. Seems more likely to me that this will either break down quickly again after minor consolidation or consolidate for a couple of weeks before choosing its direction.
Personally, I have little interest in the news and narratives, they are very often lagging what a chart has been indicating for a while. News
is often more foreseen by market makers than one would think and it is often too late when it is the thing everyone is talking about.
I am absolutely convinced my trading results would be superior if I never read or listen to the news at all, but that is not a simple path to take given that life is about way more than money...
Personally, I will be watching a bit longer before doing any "bottom picking"... Won't be touching my long-term position regardless, and gratefully could see more downside than any chart is currently indicating before jeopardizing my average price. I have been extra cautious with
how and when I average up over the last 2+ years, for situations such as these (saved me as well in 2020). For a trader like myself to see a story
through as long as this, is quite unique (and challenging), but for now my confidence remains well intact.
GLTA.
View attachment 1755 View attachment 1754
Just a quick update on previously mentioned chart formations...
General Market and Nasdaq in particular attempting another bounce at critical levels. Whether the IXIC has seen its bottom or wants to create a more substantial and symmetrical right shoulder remains to be seen.
BRN has finally tested the first semi-viable level of support IMHO from the previous high at 0.97 and is seeing some buying activity in line with the general market. It is worth noting how well the 5-week SMA has continued to maintain dominance with recurring retests and failures.
Personally, I will be waiting for a little more market confirmation before adding to my position but this is the first time I am even partially inclined to take a shot.
GLAT
Last edited:
thanks RocketStan always comes up with a good breakdown on who’s buying and who’s selling, but I couldn’t post a link so copied and pasted it unfortunately, unless someone else can.
hi Dolci:
I too have be told that about the gaps, it seems the gap on the 1st of Jan around 70c is the second gap since this run, while the 1st gap happened on the 24/12/2021. I was told that normally the 1st gap won't need to be filled, but the second one onward inevitably always get filled. I am just wondering if this is how you know about the gaps theory as well?
regarding to the broker data, when the RSI reached 90, I had every reason to sell a big portion but I didn't, because of what I see in the broker data. the Data shows even if you look at the data from March 2021, the majority of insto are starting to have paper losses as their average buy price was around $1 from 12/03/2021 to 11/03/2022.

now if look at the data from 4/1/22 where mecedes news came out. it is clear that retailer investors were the major seller while instos bought like crazy with average buy price at over $1.5

The peak three days happened on 18th, 19th and 20th of Jan. where the RSI reached 90, and looking at the data on each of those days, especially what jp morgan did on the 19th (net bought 10m shares at $2). That was what turned my mind away from selling any of my long term holdings.


One thing I am sure is that this the broker data for this wrong was totally different from the one in september 2020,
here is the data from March 2020 to March 2021. It clearly shows that retailer brokers were top net buyers, while instos sold huge amount of stocks. completely opposite to the data between March 2021 to March 2022

So, my questions is, why would these instos allow itself to accumulate so many brn shares and let the price slide below their average cost? Especially when all of us know that Brainchip's fundamentally has being stronger and stronger.
My guess is that instos are intending to shake out more retail investors, especially the multi-baggers. and if that is the case. To do that, they will use small amount of shares to drive down the price day by day until some retail holders start to lose patience or even faith. I think this is how insto can break down some of the diamond hands.
So this my understanding. At the moment, on the daily chart, althought RSI is very close to oversold, but the weekly chart, MACD just started to cross downwards since last week. so I guess not yet a clear sign of rebound?
From the weekly chart we can see since 2020, we had three major run and dip, both the sep2020 dip and march2021 dip bottomed right on the moving average line.

I only started to learn technical analysis. I hope you and any other technical analyst could shed some more light on this one.
thanks in advance.
i also reposted the content in the broker data thread here. Unfortunately it seems that no many chartists are reacting to it. Maybe people are depressed about this dip.
Fastback6666
Regular
BRN are in full blown commercialisation mode which has started only recently with the chip being full tested and IP and hardware now available. BRN are out there partnering and selling hard now as they have the product. Big news and multiples of it now can drop and day, week or month.
The SP is cheap enough now to add to position before the next big news item(s) so I am buying more each fortnight while it is back down at $1 flat and below and will keep adding while I can as soon enough it will be much higher $2..$3...$4 and we will all be saying - I wish I bought more when it dropped to $1 flat as we knew the chip was confirmed as working and Mercedes and others were known to be using it which validates the tech in real world and with blue chip companies.
Add while you can as the price is definitely not expensive for what we know now.
DYOR and not financial advice.
Last edited:
Fastback6666
Regular
Cyw
Regular
Looks like something big is coming up. The closing auction is going nuts.Some really nice big chunky buys just went through to take out nearly a million shares at .96. On the upside. The buyers want them this cheap.
Fastback6666
Regular
I thought the same thing for a minute until I looked at the date and realised it is the quarterly rebalance for institutional traders. Where there is a lot of volume at closing auction to re-position themselves, happens in all the stocks today. Anyway nice that it made it go up a few cents.Looks like something big is coming up. The closing auction is going nuts.
Fastback6666
Regular
Look at that very large million share insto wall at .95 looking to protect their recent base investment as their average buys are sitting around that level looking recent buying. Good for us that it helps the price not go much lower.
Last edited:
D
Deleted member 118
Guest
Nasdaq down overnight, so we should go green lol
Last edited by a moderator:
Falling Knife
Regular
Today's trading is different ....
The lowest volume since 21st December 2021 which was 7 million shares.
Have the sellers and panic exits dried up?
Is the base finally in?, do we get some traction now and will news come to support.
Today’s volumes are reminiscent of the 1% volume days which did seem to go on forever")
The lowest volume since 21st December 2021 which was 7 million shares.
Have the sellers and panic exits dried up?
Is the base finally in?, do we get some traction now and will news come to support.
Today’s volumes are reminiscent of the 1% volume days which did seem to go on forever
Last edited:
D
Deleted member 118
Guest
Nasdaq up over 2% tonight, so we should see a red day lol
Fastback6666
Regular
Yes sure feels like a base forming at around .95... hoping not much lower.Today's trading is different ....
The lowest volume since 21st December 2021 which was 7 million shares.
Have the sellers and panic exits dried up?
Is the base finally in?, do we get some traction now and will news come to support.
Today’s volumes are reminiscent of the 1% volume days which did seem to go on forever
With US market sentiment positive due seeing a fed plan and some recovery there this helps stabilise stocks and will see some beaten down ones finally move up. But some more deal news would be fantastic from BRN....we know BRN are doing a lot behind the scenes...just need that news flow.
Fastback6666
Regular
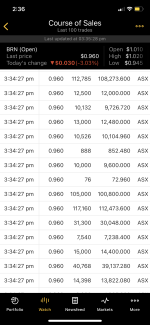
Damn that was a fun a quick line wipe to watch that 1.4 million wall at .99 to be bought up. The big boys are just sucking up these cheap shares here!
Look at the buys:

Look at the buys:
Falling Knife
Regular
Damn that was a fun a quick line wipe to watch that 1.4 million wall at .99 to be bought up. The big boys are just sucking up these cheap shares here!
Look at the buys:
View attachment 3013
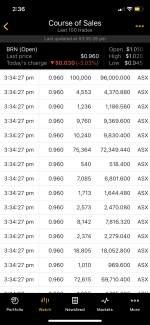
The above was all part of a single trade:
Here are other trades above 100K
Please crack a buck today and use that as the support....
Sentiment is becoming more bullish
Last edited:
Fastback6666
Regular
Thanks for posting the chart. Leveling out out of that consolidation is great to see. Not much selling left in the tank now, will be more buying than selling you would expect from here. But you can see the bigger players trying to keep a lid on this price for as long as they can.The above was all part of a single trade:
View attachment 3014
Here are other trades above 100K
View attachment 3015
Please crack a buck today and use that as the support....
Sentiment is becoming more bullish
View attachment 3020
Yes agreed on that sale of 1.5mil. All at the same time, a large buy...great confidence to see when the market had been so sold off generally recently. You know if you are accumulating more here you are pretty safe.
YLJ
Swing/Position Trader
For anyone who has been following my flow of thoughts... BRN has been consolidating around the above-mentioned level, which is good. Unfortunately, it has shown relative weakness against the bounce in the Nasdaq which closed above its 5-week SMA last week for the first time since the acceleration of the decline. This provided a platform for quite a few nice swing trades this week across other stocks, but BRN has lagged.View attachment 2684
View attachment 2685
Just a quick update on previously mentioned chart formations...
General Market and Nasdaq in particular attempting another bounce at critical levels. Whether the IXIC has seen its bottom or wants to create a more substantial and symmetrical right shoulder remains to be seen.
BRN has finally tested the first semi-viable level of support IMHO from the previous high at 0.97 and is seeing some buying activity in line with the general market. It is worth noting how well the 5-week SMA has continued to maintain dominance with recurring retests and failures.
Personally, I will be waiting for a little more market confirmation before adding to my position but this is the first time I am even partially inclined to take a shot.
GLAT
My concern is that the IXIC (as well as NDX & Futures) are now approaching resistance. If it is sold down again, there is IMHO a chance that BRN sees another leg down, which is why I continue to wait with challenging patience for my top-up. I still consider the possibility that a larger and more symmetrical right shoulder could be formed. Until this point, Classical Charting principles have been remarkably accurate and have kept me out of a lot of trouble. Some news flow would be most welcome, despite my desire to add to my holdings at a level I feel holds little chance of
being breached to the downside...
GLTA
Fastback6666
Regular
A strong $1.02 finish, very nice late run!
Similar threads
- Replies
- 0
- Views
- 1K
- Replies
- 9
- Views
- 6K