Technical Analysis

zeeb0t

Administrator
Staff member
Most of my positions are managed ahead of time and on days like today I like to either get out for some fresh air or
reflect on my perspective on markets and trading.
The following chart compares Calendar Years: 2020,2021 & 2022 (to date) performance of BRN, the XJO
the Vanguard Value ETF (VTV) & the Vanguard Growth ETF (VUG):

XJOBRNVTVVUG
2020-2.17%+855.56%+0.29%39.10%
2021+13%+77%+23.32%66.34%
2022 to date-4.35%+55.55%-2.51%-14.81
Recent Peak to current price-6.07-49.40%-5.08%-16.38%

There is so much to glean from this comparison IMHO about markets, sectors, BRN, and emotions. I will point out only a few...
  1. The bulk of "quick" large fortunes are made by those who get in very early. Similar fortunes may realistically be made only with a much larger time frame if coming to the party later.
  2. Entering at the "wrong" time can be very painful if you are not honestly prepared to see things through because of true fundamental conviction, are over-exposed, or lack a realistic view of how markets behave.
  3. Warren Buffett famously said: “Unless you can watch your stock holding decline by 50% without becoming panic-stricken, you should not be in the stock market.” If you understand the crowd he was addressing, it will be clear why this applies tenfold to a company like BRN! I would add that you should not be "investing" in the stock market, trading is another story if you really know what you are doing.
  4. Growth stocks outperform the market when there is confidence (or greed), but underperform when there is a concern (or fear). Growth stocks have recently fallen out of favour, which should come as no surprise given current macro factors.
  5. BRN is a volatile stock (for better & worse), the implications this can have on one's portfolio fluctuations are extreme and emotions will most likely be too. You have to be realistic and at the very least know what you can handle.
  6. Risk & Reward go hand in hand.
  7. BRN has still outperformed over almost any longer-term time frame by a very large margin.
As a chartist, I do not rely on predicting when and what news will step in to lend a helping hand. Moreover, you can give me a chart of
almost any company in the world, and if I want to find a technical narrative that supports an entry I could. With the myriad of technical indicators and ways they may be used, there is always a way to see what you want to see if you allow yourself. This is one of the greatest
dangers of TA. I hope a juicy announcement is forthcoming...
GLTA

This is a really interesting chart and I think some should really reflect upon this before writing. Well done, sent you a small tip in recognition.
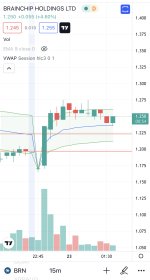
 
  • Like
Reactions: 15 users

Damo4

Regular
I'm not a trader but it's uncanny how we hit oversold RSI territory (4hr) and the price jumps back up.
It's nice being a LTH and not stressing about the daily numbers to be honest.
 
  • Like
Reactions: 7 users

TheFunkMachine

seeds have the potential to become trees.
From a pure trading perspective it is looking pretty good atm. It could be a false signal etc, but if you look at Vwap it has broken Vwap and then come back to test it and found support. Good indicator for more upward movements. I don’t trade BRN anymore and am happy to ride out any volatility as long term this have never looked better, but for those interested this is what I see:) a break above 1.275could also mean good things 👍🏻
 

Attachments

  • 85C88623-8EC0-437A-87CC-3DA8193DB0FF.jpeg
    85C88623-8EC0-437A-87CC-3DA8193DB0FF.jpeg
    338.5 KB · Views: 77
  • Like
Reactions: 22 users

7SOL

Emerged
From a pure trading perspective it is looking pretty good atm. It could be a false signal etc, but if you look at Vwap it has broken Vwap and then come back to test it and found support. Good indicator for more upward movements. I don’t trade BRN anymore and am happy to ride out any volatility as long term this have never looked better, but for those interested this is what I see:) a break above 1.275could also mean good things 👍🏻
Does todays price action change that?
 

alwaysgreen

Top 20
Does todays price action change that?
TA does not take into account Russians dropping bombs.
 
  • Like
  • Sad
Reactions: 5 users

TheFunkMachine

seeds have the potential to become trees.
Does todays price action change that?
Yes, previous pattern does not apply. It has been a terrible day at the market and Russia Ukrain conflict is most likely to blame here. However it has created a double bottom for now @1.16 so if this holds tomorrow it could be a good signal. Time will tell my friend.
 
  • Like
Reactions: 6 users
US markets look absolutely smashed. I hope we hold $1. You never know what happens with situations such as this. Let’s all hope and pray for the innocent civilians, men, women and children
 
  • Like
  • Love
Reactions: 18 users

YLJ

Swing/Position Trader
Yes, previous pattern does not apply. It has been a terrible day at the market and Russia Ukrain conflict is most likely to blame here. However it has created a double bottom for now @1.16 so if this holds tomorrow it could be a good signal. Time will tell my friend.
I struggle to see a Double Bottom on any time frame. IMHO looks more like an intrinsically bearish continuation H&S on the smaller time frames. Textbook Double Bottoms are never really valid on such time-frames, as part of their definition is the duration between the "bottoms",
though they have become widely used on social media and do fulfill their implications occasionally.
5-day SMA was merely retested yesterday and still seems pretty in control. The bottom could come in at any time in theory though...

Edit: A few quotes from R.W Schabacker on the Double Bottom/Top formation:

  • "...one of the most loosely and glibly discussed of all reversal patterns – the Double Top (or, in its opposite manifestation, the Double Bottom). The layman who has followed the financial columns in the daily papers or listened to board room gossip has undoubtedly heard it mentioned frequently. It is referred to so often by superficial writers that the beginner is likely to believe it a common and reliable indication of technical reversal, requiring little study. Unfortunately, this is not the case..."
  • "More important even than the volume factor, is the matter of the extent of the decline from the first top and the duration of the interval between tops...there should be more than just a few days’ elapse before the second attempt is made to run the stock up through the previous top level. Speaking very generally, the longer the time interval between the two tops, the more important the pattern becomes as a signal of a major reversal.
  • "The danger in making a heavy commitment in stock on the strength of a Double Top which does not conform in all respects to the requirements we have set up for a true reversal formation. It must be admitted, however, that stocks do occasionally reverse their trend after making two tops only a few days apart."
  • "...it must be recalled that many important moves take place without any forecasting patterns appearing on the chart."
A few more from Edwards & Magee:
  • "True Double Tops and Double Bottoms are exceedingly rare"
  • ...if two Tops appear at the same level but quite close together in time and with only a Minor Reaction between them, the chances are that
    they are part of a Consolidation Area..."
  • "Thus, if the two Tops are more than a month apart, they are not likely to belong to the same Consolidation or Congestion Formation...
    "There are cases in which the two peaks have occurred only 2 or 3 weeks apart."
  • "The success of that test is not proved, however — and this is a point to remember — until prices have demonstrated their ability to rise on increasing volume above the preceding high (the height of the rally between the two Bottoms). Until such time as that has happened, there always the possibility that a second test (third bottom) may be necessary, or even a third, and that one of these will fail, with prices then breaking on down into further decline."
That last point is very important for a great many Classical Charting Patterns (as they both point out in their works): They are not really
valid patterns until they have been confirmed with a breakout (on volume) from the defined breakout boundary levels. Of course, one must
identify potential patterns whilst still information in order to be able to capitalize on them if they eventuate, but a great many times they don't.
That is also why pre-emptive breakout trading is a dangerous game. The success rate is far lower (though profits can be increased by getting in early). As a forecasting tool, they should logically be treated with a greater degree of suspicion.
 
Last edited:
  • Like
Reactions: 5 users
D

Deleted member 118

Guest
Nasdaq currently up
 
  • Like
Reactions: 5 users
D

Deleted member 118

Guest
35D07CEE-CAFF-4B1C-B159-D74045ED3C39.jpeg
 
  • Like
Reactions: 15 users

mkg6R

Member
Nasdaq looking good over 400 points up :)
 
  • Like
Reactions: 2 users

YLJ

Swing/Position Trader
Here is an update to my previous few posts here regarding BRN and the position of the
Nasdaq (following their more recent correlation) & why IMHO short term bulls should
be cautious. I would love an announcemt to re-light the flames here, but I am equally
okay with the possiblity of a long-term top up opportunity if price is so inclined.
Will be patient on both fronts...
GLTA

View attachment 1489
View attachment 1490
View attachment 1493
Here are a few updates on my thinking & why I have been and still am indicating caution on near/medium-term price possibilities.
This is all the more relevant for traders who need to be very clear on their trade time-frames and stop-loss management. It is not BRN specific, but as mentioned before, I believe it is having a major effect and may well continue to do so.

The chart I posted in the quoted post was the Nasdaq 100 E-mini Futures. Price has just wicked off the area of the 50-week Bollinger bands
and the May 2021 lows (support). The daily H&S on E-mini Futures has not met its measured target, but the same pattern as it formed
on the actual Nasdaq 100 (NDX) & Nasdaq Composite Index (IXIC) did reach their targets, from which they have bounced up today.
It is theoretically possible we have seen a bottom, but IMHO the market is in a very delicate position. There are arguments for a much larger H&S weekly top being formed on some of the above-mentioned variations of charts on the Nasdaq (some more convincing than others & with slightly different implications). The more down-slanted neckline of the NDX vs the Horizontal one on the IXIC indicates that there is more concern about the large valuations (PE multiples and growth expectations) of the larger tech stocks. These patterns need to be resolved, but
the situation is intense. I do not see much of a chance of a quick return to previous highs. Seems more likely to me that this will either break down quickly again after minor consolidation or consolidate for a couple of weeks before choosing its direction.
Personally, I have little interest in the news and narratives, they are very often lagging what a chart has been indicating for a while. News
is often more foreseen by market makers than one would think and it is often too late when it is the thing everyone is talking about.
I am absolutely convinced my trading results would be superior if I never read or listen to the news at all, but that is not a simple path to take given that life is about way more than money...
Personally, I will be watching a bit longer before doing any "bottom picking"... Won't be touching my long-term position regardless, and gratefully could see more downside than any chart is currently indicating before jeopardizing my average price. I have been extra cautious with
how and when I average up over the last 2+ years, for situations such as these (saved me as well in 2020). For a trader like myself to see a story
through as long as this, is quite unique (and challenging), but for now my confidence remains well intact.
GLTA.
1645738079091.png
1645737001194.png
 
Last edited:
  • Like
Reactions: 9 users

YLJ

Swing/Position Trader
Excellent post, geopolitical crises have historically on average had little effect on markets over any meaningful timeframe.
Honestly though, IMHO I don't think the Ukraine issue, despite taking all the current headlines, is the greatest
danger facing the markets right now. Then again, I don't give too much weight to my thoughts on macro issues.
1645736272239.png
 

Attachments

  • 1645736341140.png
    1645736341140.png
    199.3 KB · Views: 51
  • Like
  • Love
Reactions: 5 users
D

Deleted member 118

Guest
Excellent post, geopolitical crises have historically on average had little effect on markets over any meaningful timeframe.
Honestly though, IMHO I don't think the Ukraine issue, despite taking all the current headlines, is the greatest
danger facing the markets right now. Then again, I don't give too much weight to my thoughts on macro issues.
View attachment 1751
If this conflict happened this time last year, do you really think it would have made this amount of media coverage when the world was more worried about Covid?
 
  • Like
Reactions: 1 users

TheFunkMachine

seeds have the potential to become trees.
I struggle to see a Double Bottom on any time frame. IMHO looks more like an intrinsically bearish continuation H&S on the smaller time frames. Textbook Double Bottoms are never really valid on such time-frames, as part of their definition is the duration between the "bottoms",
though they have become widely used on social media and do fulfill their implications occasionally.
5-day SMA was merely retested yesterday and still seems pretty in control. The bottom could come in at any time in theory though...

Edit: A few quotes from R.W Schabacker on the Double Bottom/Top formation:

  • "...one of the most loosely and glibly discussed of all reversal patterns – the Double Top (or, in its opposite manifestation, the Double Bottom). The layman who has followed the financial columns in the daily papers or listened to board room gossip has undoubtedly heard it mentioned frequently. It is referred to so often by superficial writers that the beginner is likely to believe it a common and reliable indication of technical reversal, requiring little study. Unfortunately, this is not the case..."
  • "More important even than the volume factor, is the matter of the extent of the decline from the first top and the duration of the interval between tops...there should be more than just a few days’ elapse before the second attempt is made to run the stock up through the previous top level. Speaking very generally, the longer the time interval between the two tops, the more important the pattern becomes as a signal of a major reversal.
  • "The danger in making a heavy commitment in stock on the strength of a Double Top which does not conform in all respects to the requirements we have set up for a true reversal formation. It must be admitted, however, that stocks do occasionally reverse their trend after making two tops only a few days apart."
  • "...it must be recalled that many important moves take place without any forecasting patterns appearing on the chart."
A few more from Edwards & Magee:
  • "True Double Tops and Double Bottoms are exceedingly rare"
  • ...if two Tops appear at the same level but quite close together in time and with only a Minor Reaction between them, the chances are that
    they are part of a Consolidation Area..."
  • "Thus, if the two Tops are more than a month apart, they are not likely to belong to the same Consolidation or Congestion Formation...
    "There are cases in which the two peaks have occurred only 2 or 3 weeks apart."
  • "The success of that test is not proved, however — and this is a point to remember — until prices have demonstrated their ability to rise on increasing volume above the preceding high (the height of the rally between the two Bottoms). Until such time as that has happened, there always the possibility that a second test (third bottom) may be necessary, or even a third, and that one of these will fail, with prices then breaking on down into further decline."
That last point is very important for a great many Classical Charting Patterns (as they both point out in their works): They are not really
valid patterns until they have been confirmed with a breakout (on volume) from the defined breakout boundary levels. Of course, one must
identify potential patterns whilst still information in order to be able to capitalize on them if they eventuate, but a great many times they don't.
That is also why pre-emptive breakout trading is a dangerous game. The success rate is far lower (though profits can be increased by getting in early). As a forecasting tool, they should logically be treated with a greater degree of suspicion.
I used the term double bottom loosely here. What I should have said was that it has tried to push trough 1.16 twice and seems to have formed some support. (This is more obvious on a 15min chart) It is hard to say where the bottom is, but mearly stated the fact that 1.16 looked good if it can hold this level. Obviously it can go down further and I would use 1.16 as a gauge as to where it will go next. :) tea leafs
 
  • Like
Reactions: 4 users
Still a little way to go as one good day doesn't make or change a trend obviously.

Watching a poss falling wedge maybe coming into play which can provide a bullish reversal to be confirmed on upward break with supporting volume. Personally be looking at around 1.40 / 1.45 break with good vol & poss retest of supp to then continue upwards.


BRN D BAR BASS FIB 25.2.22.jpg
 
  • Like
Reactions: 14 users

YLJ

Swing/Position Trader
I used the term double bottom loosely here. What I should have said was that it has tried to push trough 1.16 twice and seems to have formed some support. (This is more obvious on a 15min chart) It is hard to say where the bottom is, but mearly stated the fact that 1.16 looked good if it can hold this level. Obviously it can go down further and I would use 1.16 as a gauge as to where it will go next. 😂 tea leafs
Fair enough, most do. I hope you use the "tea leaves" term that way too😂, though many see charting that way too.
 
  • Like
  • Haha
Reactions: 6 users

TheFunkMachine

seeds have the potential to become trees.
Some tight trading between $1.16 and 1.28 atm forming a new base by the looks of it. A good ann from here would take out ATH IMO. Cmon Samsung, I know you’ve been sniffing around the BRN campground.. that sweet sweet smell of Akida tech must be looking good for the Samsung recipe??
 
  • Like
  • Fire
Reactions: 14 users
Still a little way to go as one good day doesn't make or change a trend obviously.

Watching a poss falling wedge maybe coming into play which can provide a bullish reversal to be confirmed on upward break with supporting volume. Personally be looking at around 1.40 / 1.45 break with good vol & poss retest of supp to then continue upwards.


View attachment 1775

Thought post an updated chart & an hourly one fwiw.

Could updated notes in white.


BRN D BASS FIB.jpg


BRN HRLY BAR SWINGS.jpg
 
  • Like
  • Fire
Reactions: 16 users

YLJ

Swing/Position Trader
Thought post an updated chart & an hourly one fwiw.

Could updated notes in white.


View attachment 2055

View attachment 2056
Great charts, as always.

My daily point of view:
1646207752948.png

The current daily range can be viewed as a possible bear flag in formation. The direction of the
break and volume will be the best indication of implications of this consolidation, though
upside will be walking straight into resistance.
I'm still tracking the Nasdaq as a major indicator unless we diverge or get BRN specific news.
Everyone seemed to get very excited about the strong bounce at the end of last week, but
I see this as nothing more than a Textbook retest of the H&S neckline and weekly 5-SMA.
These levels need to be cleared before I will be inclined to confidence.
If BRN does see another meaningful leg down, I think I will be forced to average up (calculatedly).
1646208000533.png


Don't usually look at this stuff but came across this Excellent video today from some Sotckcharts.com analysts for those interested in Whykoff's methodology:
Overall idea seems very similar to my perspective with some more bull side possibility analysis as well towards the end that
is very well presented and balanced IMHO.
https://stockcharts.com/articles/wyckoff/2022/03/distribution-or-reaccumulation-699.html
 
Last edited:
  • Like
Reactions: 13 users
Top Bottom