Fact Finder
Top 20
That image is enough reason not to make it to the next one. Visually very disturbing. FF
AKIDA BALLISTAaaaa - said as if sighing.
Agree though with US recovery looks like a possible green day.
Last edited:
Just wondering what the one share on the sell side indicates Right on 7am 1 on the sell side 93c then later moved to 92.5 then back to 93 nowThat imagine is enough reason not to make to the next one. Visually very disturbing. FF
AKIDA BALLISTAaaaa - said as if sighing.
Agree though with US recovery looks like a possible green day.
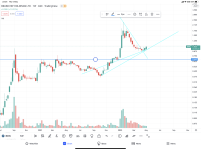
Looks like BrN chart way back in 2000 when it hit .90 and fell back to .35So, I've looked to create a couple of cleaner charts as I know a lot of mine can be quite busy (colourful haha) with some simpler momentum info.
Today is a nice start but one day doesn't make a trend or BO. Next week more interesting.
Both daily.
1. Summary panel with multiple moving averages, oscillators & pivots that attempts to pick up where they all sit.
2. Visual 20 / 50 EMA plus can see swing pivots.
3. Supp / Resist lines that thicken with multiple tests of the level. Can clearly see the ranging recently.
4. Vol splits looks for todays & past 5 days so can see when balance tips more buying.
5. RSI Bias. If in the channel is more neutral. BO above channel & down outside channel gives bull / bear bias. Blue has bull bias & orange a bear bias and paints the SP bars. Blue stronger bull, green weaker, orange stronger bear & yellow weaker.
View attachment 5623
1. Monthly vol profile to look at levels where most vol traded with point of control the extended white lines.
2. Monthly pivots for bull / bear & poss supp / resist points.
3. Individual pivot swings.
4. Another indicator summary.
5. Tilson T3 moving average that changes colour on crosses & direction helps on trend moves eg up, down or flat.
6. Same as point 4 first chart.
View attachment 5625
Happy belated birthday FF. You went over Brainchips head this year and went straight to the US Federal Reserve to get your green birthday wish.That image is enough reason not to make it to the next one. Visually very disturbing. FF
AKIDA BALLISTAaaaa - said as if sighing.
Agree though with US recovery looks like a possible green day.
Their seven days early.Happy belated birthday FF. You went over Brainchips head this year and went straight to the US Federal Reserve to get your green birthday wish.
Oh close enough!Their seven days early.
FF
So, I've looked to create a couple of cleaner charts as I know a lot of mine can be quite busy (colourful haha) with some simpler momentum info.
Today is a nice start but one day doesn't make a trend or BO. Next week more interesting.
Both daily.
1. Summary panel with multiple moving averages, oscillators & pivots that attempts to pick up where they all sit.
2. Visual 20 / 50 EMA plus can see swing pivots.
3. Supp / Resist lines that thicken with multiple tests of the level. Can clearly see the ranging recently.
4. Vol splits looks for todays & past 5 days so can see when balance tips more buying.
5. RSI Bias. If in the channel is more neutral. BO above channel & down outside channel gives bull / bear bias. Blue has bull bias & orange a bear bias and paints the SP bars. Blue stronger bull, green weaker, orange stronger bear & yellow weaker.
View attachment 5623
1. Monthly vol profile to look at levels where most vol traded with point of control the extended white lines.
2. Monthly pivots for bull / bear & poss supp / resist points.
3. Individual pivot swings.
4. Another indicator summary.
5. Tilson T3 moving average that changes colour on crosses & direction helps on trend moves eg up, down or flat.
6. Same as point 4 first chart.
View attachment 5625
More chance of breaking out here without major news. Not that recent news ainβt major.Didn't get chance to post update to the old 3 hrly I posted previously.
Into that upper range level again. Will still need carry momentum next week to try BO to that next level.
View attachment 5651
Unfortunately, in the words of the great Finn brothers, today "I see red, I see red, I see red".Be a great day today if we can keep hold of most of yesterdays gains.
Nasdaq closes down 5% in sharpest fall since 2020
Heavy stock and bond sell-off erases prior dayβs gains as investors engage in βcapitulation tradeβwww.ft.com
View attachment 5667
Not BrainChip. Up 8.3% in a sea of red!Unfortunately, in the words of the great Finn brothers, today "I see red, I see red, I see red".
Shocking night in the US. Growth tech stocks hammered.
Yes but Microsoft, nvidia, Intel and Apple all finished up...Unfortunately, in the words of the great Finn brothers, today "I see red, I see red, I see red".
Shocking night in the US. Growth tech stocks hammered.
Dropped to 95c and recovering well. Maybe close today over $1 againBased on the current buy vs sell side I see our share price and resilience remaining strong during this choppy day of trading.
Love the song and the band but I think I will listen to Green Day today, good to see that the Aussies are not like the American IdiotsUnfortunately, in the words of the great Finn brothers, today "I see red, I see red, I see red".
Shocking night in the US. Growth tech stocks hammered.
My bad... :/