So, I've looked to create a couple of cleaner charts as I know a lot of mine can be quite busy (colourful haha) with some simpler momentum info.
Today is a nice start but one day doesn't make a trend or BO. Next week more interesting.
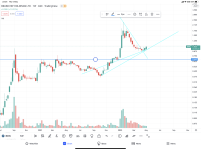
Both daily.
1. Summary panel with multiple moving averages, oscillators & pivots that attempts to pick up where they all sit.
2. Visual 20 / 50 EMA plus can see swing pivots.
3. Supp / Resist lines that thicken with multiple tests of the level. Can clearly see the ranging recently.
4. Vol splits looks for todays & past 5 days so can see when balance tips more buying.
5. RSI Bias. If in the channel is more neutral. BO above channel & down outside channel gives bull / bear bias. Blue has bull bias & orange a bear bias and paints the SP bars. Blue stronger bull, green weaker, orange stronger bear & yellow weaker.
View attachment 5623
1. Monthly vol profile to look at levels where most vol traded with point of control the extended white lines.
2. Monthly pivots for bull / bear & poss supp / resist points.
3. Individual pivot swings.
4. Another indicator summary.
5. Tilson T3 moving average that changes colour on crosses & direction helps on trend moves eg up, down or flat.
6. Same as point 4 first chart.
View attachment 5625
FF


") I would of posted yesterday but was on a plane to Dubai..
I would of posted yesterday but was on a plane to Dubai..