Hi
@Terroni2105
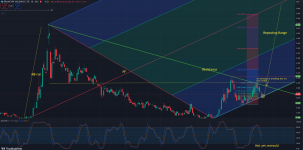
Gonna throw up some various charts with notations as I use various styles / indicators to corroborate & add some weight to what I'm interpreting as never a pure science obviously. Welcome to ask questions on the charts if need be but hopefully you'll see the same correlations in looking at them. Remember, charts do take time to evolve too.
Simple thinking though. We've moved into a tight upward channel & hitting top TL today so will be interesting to see if mkt respects that and pulls back tomorrow into the w/end. This current area also corresponds with previously indicated potential resist areas we're now into.
A lot of volume (supply) been coming in, no doubt from various sources like stale holders, traders flipping that bought over the past week, SM that have been previously accumulating etc etc. IMO it wouldn't have just been retail on the start of this run but I'm guessing SM that have been accumulating marking it up dragging in retail, some FOMO, coupled with some positive media releases but the background question still is....something tangible still has to support the move. Suspect some shorters also positioning for another push down too.
Will the Qtrly surprise & be very positive? Does the SM (or others) have an idea of this? As some have raised, is it a pump & dump into the Qtrly & a small bull trap?
Personally, I'm leaning into a bit of a buying climax at the mo (unless a leaky ship?) & happy to be wrong but just looking a little hot now. Dumps not so healthy but pullbacks, pauses, a little sideways consolidation is not a bad thing imo.
Anyway, some charts below & hope you get some value from them.


