Are you referring to LRS ?@BEISHA
Hey bro! Interesting news with CR, seems like a big investor trying to get in as they have sufficent cash! Price is set at 25C so a buying opportunity might be coming up, how does this change previous TA?
Also congrats all fellow holders of IXR
TA still bearish.
20c support is still my call, unless 30c resistance breaks to the upside...
")
Sentiment: SELL / Observe
Disclosure: I dont hold
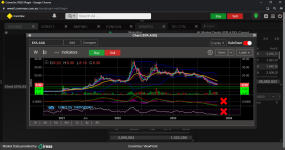
AKE
Wave 2 down found another low this week.
Dow down 280+ points Friday night, so the low may continue.
Sentiment: SELL / Observe
Disclosure: I dont hold
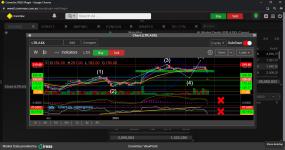
LTR
Well, finally my wave down prediction came to fruition, LTR chart has been manipulated with the ALB TO, but now that has come and gone , it forced the LTR bod to seek finance to get to production, hence C wave down was enacted and LTR has joined the rest of the lithium sector in getting a caning.
Dow down 280 pts Friday night, so i expect 175 support to get challenged.
If 175 support doesnt hold, then next support is 129.......surely not.
Sentiment: SELL / Observe
Disclosure: I dont hold.
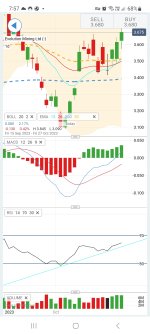
PLS
Double bottom 370 occurred during the week then bounced off, will 370 hold or will 349 support come into the equation ?
Sentiment : HOLD / Observe
Disclosure: I hold
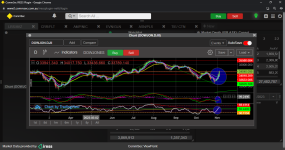
SYA
SP flattening out, indicators massively over sold and flat lined, surely the bottom is in, but, cant rule out 6.68 / 4.47 support zone ..DOW down another 280 pts, so shorters will continue to apply pressure...
Sentiment: SELL / Observe
Disclosure: I dont hold
CXO
CXO chart pretty much the same as SYA.
SP flattening, indicators flattening, MACD is encouraging , suggesting bottom is in .....but, cant rule out another drop to the lower support zone.
Sentiment: SELL / Observe
Disclosure: I dont hold
NIC
I am pretty sure 70 is the low and a bullish uptrend is in the works, but volume is low and i need to see where this minor retrace finishes , before making a call.
A break of the 81/84 resistance to the upside would confirm BUY, but for now...
Sentiment: Accumulate / Observe
Disclosure: I hold
EVN
Trend is looking good for EVN.
Solid support at 337, indicators are bullish and SP above 21 ema.
Sentiment: Accumulate
Disclosure: I dont hold.
Thats a wrap folks, but can i just remind, my sentiment towards all these stocks is based on TRADING, not long term BUY / HOLD INVESTMENT.........there is a massive difference.
If you hold any of the above stocks for the long term, continue to HOLD, they will all come good eventually, but if you are looking to TRADE, then there aint alot of opportunity...........yet.
imo