From a TA perspective only.
DYOR:
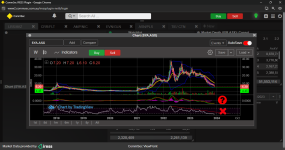
I have two ways of analysing, when the second confirms the first ( and it doesn't matter which is first), then I enter.

The sell signal ( labelled) is only valid if below the yellow line.
This chart most definitely does NOT indicate a long entry, which I presume is what you're looking for.
TBH the chart is all over the place but is definitely net negative.
My checker indicated a short entry two days ago when MACD - H (histogram) turned red and the price crossed below the fast ema
I would not give any consideration to entering long here, but obviously my opinion totally ignores FA.

On my phone, so hope charts make sense.
Happy to give my opinion (fwiw).
If you ask again in a week, the situation could be very different.
BTW @BEISHA I've not forgotten our conversation but am on holiday in the mountains of Bali until Christmas
DYOR:
I have two ways of analysing, when the second confirms the first ( and it doesn't matter which is first), then I enter.
The sell signal ( labelled) is only valid if below the yellow line.
This chart most definitely does NOT indicate a long entry, which I presume is what you're looking for.
TBH the chart is all over the place but is definitely net negative.
My checker indicated a short entry two days ago when MACD - H (histogram) turned red and the price crossed below the fast ema
I would not give any consideration to entering long here, but obviously my opinion totally ignores FA.
On my phone, so hope charts make sense.
Happy to give my opinion (fwiw).
If you ask again in a week, the situation could be very different.
BTW @BEISHA I've not forgotten our conversation but am on holiday in the mountains of Bali until Christmas
Last edited: