I have been following BRN for a while............its all about improving those sales numbers isnt it ?
View attachment 41069
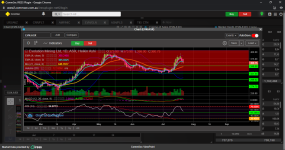
Looking at my chart............double bottom 33 is what i am looking at, which could suggest the bottom is in, all the moving averages converging, indicators look bullish, for BRN to confirm bullish trend, then hopefully minor sub wave 3 up is activated and breaks that strong resistance at 40/44......for that to happen FA needs a spark..

33c support needs to hold, or else, more lower lows ensue.
SENTIMENT: HOLD
DISCLOSURE: I DONT HOLD
AKE
View attachment 41073
WEEKLY CHART
Clear distribution going on with AKE , double top 1704, blue bubble displaying lower lows, RSI 14 is displaying divergence, MACD green line curling and converging with the red line, histogram dissipating to neutral / negative.
SENTIMENT: SELL
DISCLOSURE: I DONT HOLD
LRS
View attachment 41077
Weekly Chart
Top blue bubble displaying a bearish " hang man " candle, RSI 14 curling down from a massive OB 91, and MACD still soaring, but is a laggard indicator compared to RSI and histogram suggests its reached its peak.
Alot of red flags.
SENTIMENT: SELL
DISCLOSURE: I DONT HOLD
LTR
View attachment 41079
WEEKLY CHART
LTR still range bound from the upper support zone to 319, but if you look at the indicators, they look rather bearish...

MACD - green line has broken thru the red signal line to the downside, coming down friom a great height, histogram is in negative territory.
RSI 14 trend has broken to the downside.
Still believe sub wave 4 down is is taking place, with likely support coming around 200/215.
So for those reasons.......
SENTIMENT : SELL
DISCLOSURE: I DONT HOLD
PLS
View attachment 41097
WEEKLY CHART
I am of the opinion that PLS is only half way thru a major wave 5 up movement, blue shaded area is the start of sub wave 3 up and has a 1.618 fib target of 935.
The long term trend is certainly your friend here, indicators are bullish with plenty of room to move.
SP is above the 4, 8, 21 ema, cant really fault the chart, plenty of bullish flags here, so accordingly sentiment is upgraded
SENTIMENT: BUY
DISCLOSURE: I HOLD ( topped up this week )
NIC
View attachment 41099
WEEKLY CHART
NIC has completed a full set of 5 waves ( wave 1 up ) and completed ABC wave 2 down, currently SP may have completed sub wave 2 down, (within a much larger wave 3 up movement ), with the 61 fib ( 82 ) acting as potential support,
Indicators are biased towards neutral / negative, so not sure where SP is going atm, all i do know is the NICKLE price has stabilised and has a bullish bias, so hoping SP folllows that trend, as it should.
SENTIMENT: HOLD
DISCLOSURE: I HOLD
EVN
View attachment 41107
Nice short term trend forming for EVN , needs to break that strong resistance zone at 402, then the chart opens up, with minimal resistance until 502.
Strong support at 318, indicators have a bullish bias.
SENTIMENT : ACCUMULATE / BUY
DISCLOSURE: I DONT HOLD, but watching closely.
EMC
View attachment 41111
WEEKLY CHART
Indicators still way too high for my liking, RSI 14 has broken trend, pointing south, MACD green line flattening from a high position, with histogram dissipating from its high point.
SENTIMENT: SELL / OBSERVE
DISCLOSURE: I DONT HOLD, but observing
Thats a wrap folks !


