Perhaps old news ..
February 19, 2024
by
Michelle Cometa
Computer engineering faculty member joins national initiative on neuromorphic computing
Cory Merkel contributes expertise in system development and testing strategies for the Center of Neuromorphic Computing under Extreme Environments
Share on FacebookShare on TwitterShare on LinkedInShare on RedditShare via Email
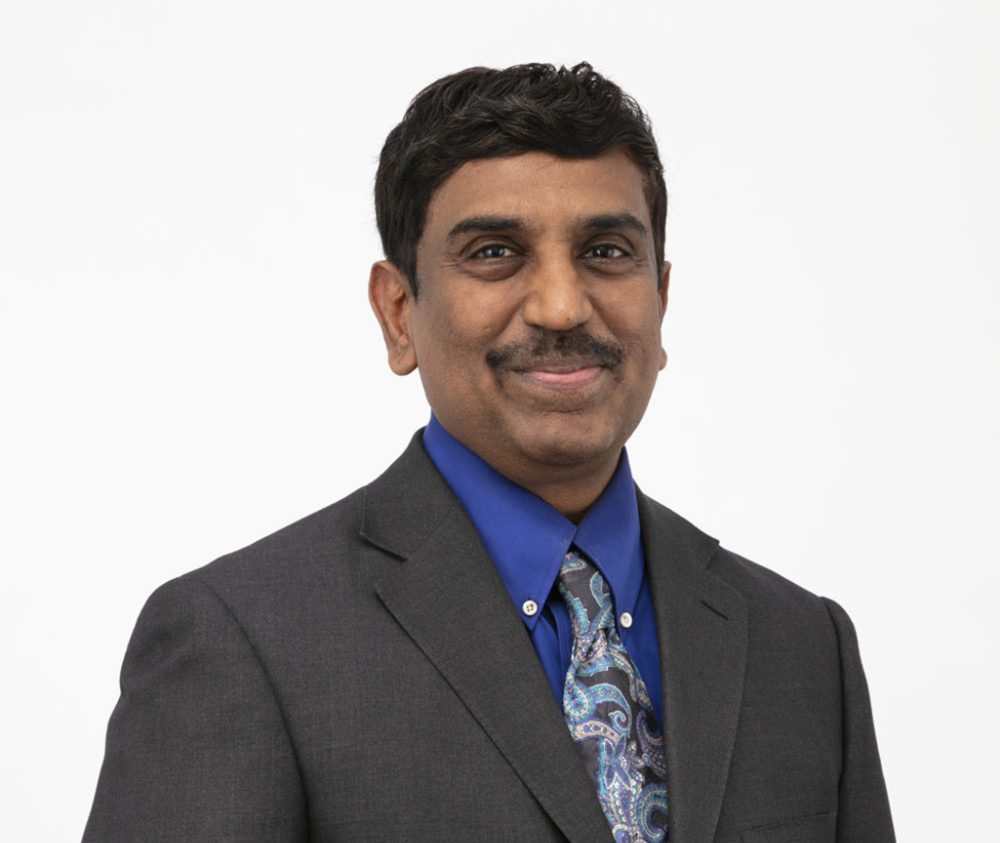
Provided/RIT
Cory Merkel, a computer engineering faculty member, will represent the university in the new Center of Neuromorphic Computing under Extreme Environments, also referred to as CONCRETE.
Cory Merkel, assistant professor of
computer engineering at Rochester Institute of Technology, will represent the university as one of five collegiate partners in the new
Center of Neuromorphic Computing under Extreme Environments, also referred to as CONCRETE.
Based at the University of Southern California, center partners will build neuromorphic computing devices and software that can be used in extreme application domains from intense temperatures to dangerous conditions, such as radiation or highly corrosive elements.
Each university will bring its own expertise to the field of neuromorphic computing, with Merkel’s research group bringing its experience in development and testing methodologies for the new devices, circuits, and materials being used to build neuromorphic computing systems.
“For a long time, neuromorphic computing has been at the fundamental stage, but now we are thinking about how to scale it up. In this project, we’re interested in overcoming scaling challenges for neuromorphic systems that are exposed to extreme environments, especially how the behavior of the system changes as a result of these conditions,” said Merkel.
Neuromorphic computing, sometimes referred to as brain-inspired computing, is a growing field of artificial intelligence focusing on developing computing infrastructure. The physical, neural network architecture and its complex processing mechanisms are inspired by natural learning mechanisms in the human brain—its evolutionary ability to process data and signals efficiently. It is a $47 million global industry and expected to increase to $1 billion by 2028, according to industry research and the American Institute of Physics, because of increased demands from fields such as automotive, healthcare and defense.
“The community is looking at scalability as a challenge, but if we want people to pay attention to neuromorphic computing, we have to demonstrate its utility in large-scale applications and applying our techniques to real-world problems,” said
Merkel, director of RIT’s
Brain Lab in the
Kate Gleason College of Engineering. Work in the lab is advancing the
security of computing systems and developing bio-inspired artificial intelligence technologies. He also is one of the inaugural members of the
BrainChip University AI Accelerator Program and a former researcher with the Air Force Research Lab.
Funded by the Air Force Office of Scientific Research and the Air Force Research Laboratory, RIT joins center leader University of Southern California and partners University of California-Los Angeles, Duke University, and University of Texas-San Antonio for the five-year, $5 million initiative. Work in developing the advanced computing system will also entail supporting university-Air Force workforce initiatives to educate the next generation workforce.
 www.eenewseurope.com


 .
.

