Bravo
Meow Meow 🐾

We needed to be doing this really fast
.gif")
but somehow we got to be facing the wrong way doing this
Bravo my lovely,The lord giveth and the lord taketh away. That's ok with me, so long as he giveth it all back again.
View attachment 51134
Only that Broadcom tech was used in the AKIDA development kit..We got any dots with anyone through to Broadcom...would be nice
Broadcom Inc. | Connecting Everything
www.broadcom.com
Broadcom Introduces Industry’s First Switch With On-Chip Neural Network
The New Trident 5-X12 Doubles Bandwidth, Reduces Power By 25%, and Adds Neural Network To Enable Next-Generation Telemetry, Security and Traffic Engineering
SAN JOSE, Calif., Nov. 30, 2023 (GLOBE NEWSWIRE) -- In a world’s first for switching silicon, Broadcom Inc. (NASDAQ:AVGO) today announced a novel on-chip, neural-network inference engine called NetGNT (Networking General-purpose Neural-network Traffic-analyzer) in its new, software-programmable Trident 5-X12 chip.

Hi Schnitzy,Bravo my lovely,
What’s your big tip for where Akida will be first mass produced into a product?
Have a nice weekend..
Only that Broadcom tech was used in the AKIDA development kit..
Akida™ Development Kit - Raspberry Pi
Specifications SoC: Broadcom BCM2711C0 quad-core ARM Cortex-A72 (ARMv8-A) 64-bit @ 1.5GHz GPU: Broadcom VideoCore VI RAM: 1GB, 2GB, 4GB, or 8GB LPDDR4 SDRAM Networking: GB Ethernet and Optional WI-FI Includes Akida on PCle Board installed in the development kit Includes Meta TF Software...www.google.com
")
Thanks DB.Only that Broadcom tech was used in the AKIDA development kit..
Akida™ Development Kit - Raspberry Pi
Specifications SoC: Broadcom BCM2711C0 quad-core ARM Cortex-A72 (ARMv8-A) 64-bit @ 1.5GHz GPU: Broadcom VideoCore VI RAM: 1GB, 2GB, 4GB, or 8GB LPDDR4 SDRAM Networking: GB Ethernet and Optional WI-FI Includes Akida on PCle Board installed in the development kit Includes Meta TF Software...
Few months old but see that Fujitsu also chasing neuromorphic program as part of their Fugaku Next processors.
Within the slides.
We got someone in Japan now hey?
Get door knocking haha

Fujitsu To Fork Arm Server Chip Line To Chase Clouds
When it comes to chips, there is a big difference between a kicker and a fork. The kicker is a successor that implements an architecture and design andwww.nextplatform.com
Fujitsu To Fork Arm Server Chip Line To Chase Clouds
Timothy Prickett Morgan
6 months ago
When it comes to chips, there is a big difference between a kicker and a fork.
The kicker is a successor that implements an architecture and design and that includes microarchitecture enhancements to boost core performance (core in the dual meanings of that word when it comes to CPUs) as well as taking advantage of chip manufacturing processes (and now packaging) to scale the performance further in a socket.
The fork is a divergence of some sort, literally a fork in the road that makes all the difference as Robert Frost might say. There can be compatibility – such as the differences between big and little cores in the Arm, Power, and now X86 markets. Intel and AMD are going to be implementing big-little core strategies in their server CPU lines this year, AMD in its “Bergamo” Epycs and Intel in its “Sierra Forest” Xeon SPs. Intel has had X86 compatible Atom and Xeon chips and now E and P cores for a decade and a half, so this is not precisely new to the world’s largest CPU maker.
And this kind of fork is what we think Japanese CPU and system maker Fujitsu will be doing with its future “Monaka” and “Fugaku-Next” processors, the former of which was revealed recently and the latter of which went onto the whiteboards with stinky markers – well, it was the beginning of a feasibility study by the Japanese Ministry of Education, Culture, Sports, Science, and Technology, with Education, Culture, Sports, Science being a variable X and thus making up the abbreviation MEXT – back in August 2022.
Fujitsu has been a tight partner of the RIKEN Lab, the country’s pre-eminent HPC research center, since the design of the $1.2 billion “Keisuko” K supercomputer, which began in 2006 to break the 10 petaflops barrier in 64-bit precision floating point processing and which was delivered in 2011. Design on the follow-on the $910 million, 513.9 petaflops “Fugaku” supercomputer, which saw Fujitsu switch from its Sparc64 architecture to a custom, vector-turbocharged Arm architecture, started in 2012. The Fugaku system was delivered in June 2020, was fully operational in 2021, and work on the Fugaku-Next system started a year later, right on schedule.
View attachment 44838
According to the roadmap put out by Fujitsu and RIKEN Lab at SC22 last November, the plan is for the Fugaku-Next machine to be operational “around 2030,” and that timing is important (we will get into that in a moment).
Here are the research ideas being tackled and the technology embodied in Fugaku-Next and who is doing the tackling:
View attachment 44839
All of the ideas you would expect in a machine being installed in six or seven years are there – a mix of traditional HPC and AI and the addition of quantum and neuromorphic computing. Supercomputers in the future will be powerful, no doubt, but it might be better called “flow computing” more than “super computing” because there will be a mix of different kinds of compute and applications comprised of workflows of different smaller applications working in concert, either in a serial manner or in iterative loops.
Significantly, Fujitsu and RIKEN are emphasizing “compatibility with the existing ecosystem” and “heterogeneous systems connected by high bandwidth networks.” Fujitsu says further that the architecture of the Fugaku-Next system will use emerging high density packaging, have energy efficient and high performance accelerators, low latency and high bandwidth memory.
If history is any guide, and with Japanese supercomputers it absolutely is, then a machine is installed in the year before it goes operational, which means Fugaku-Next will be installed in “around 2029” or so.
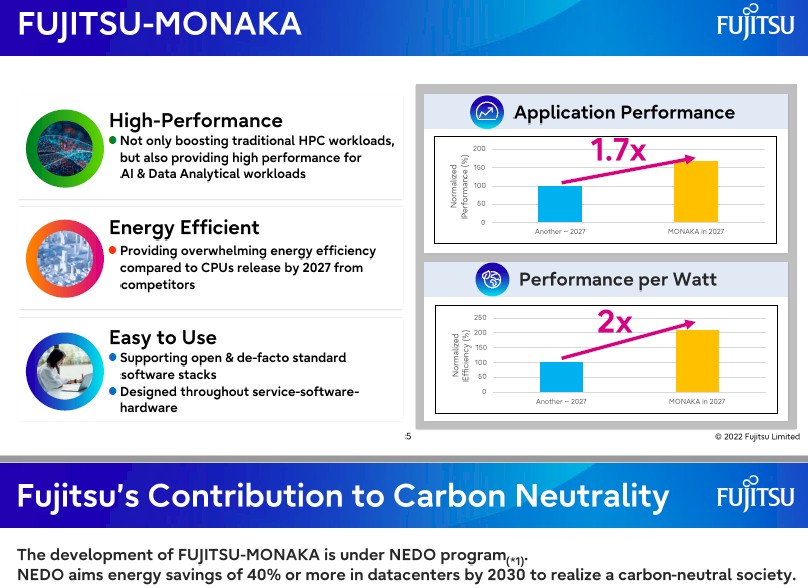
Keep that all in mind as we look at the “Monaka” CPU that Fujitsu is working on under the auspices of the Japanese government’s New Energy and Industrial Technology Development Organization (NEDO). At the end of February, Fujitsu, NEC, AIO Core, Kioxia, and Kyocera were all tapped to work on more energy efficient datacenter processing and interconnects. Specifically, the NEDO effort wants to have energy efficient server CPUs and photonics-boosts SmartNICs.
Within this effort, it looks like Fujitsu is making a derivative of the A64FX Arm processor at the heart of the Fugaku system, but people are conflating this with meaning that Monaka is the follow-on processor that will be used in the Fugaku-Next system.
This is precisely what was said: “Fujitsu will further refine this technology and develop a low-power consumption CPU that can be used in next-generation green datacenters.”
Here are the tasks assigned to the NEDO partners:
The Monaka CPU is due in 2027 and aims to provid higher performance at lower energy consumption:
- Fujitsu: Development of low-power consumption CPUs and photonics smart NIC
- NEC: Development of low-power consumption accelerators and disaggregation technologies
- AIO Core: Development of photoelectric fusion devices
- Kioxia: Development of Wideband SSD
- Fujitsu Optical Components: Development of photonics smart NIC
- Kyocera: Development of photonics smart NIC
View attachment 44840
How this will happen is unclear, but the implication is that it will be an Arm-based server processor, but one optimized for hyperscalers and cloud builders and not for HPC and AI centers. That should mean more cores and less vector processing relative to A64FX (or rather, the kicker to A64FX in Fugaku-Next system) and very likely the addition of low-precision matrix math units for AI inference. Something conceptually like Intel’s “Sapphire Rapids” Xeon SPs and future AMD Epyc processors with Xilinx DSP AI engines in terms of capabilities, but with an Arm core and a focus on energy efficiency, much higher performance per watt.
In fact, as Fujitsu looks ahead to 2027, when Monaka will go into production systems, it says it will be able to deliver 1.7X the application performance and 2X the performance per watt of “Another – 2027” CPU, whatever that might be.
The confusing bit, which has led some people to believe that Monaka is the processor that will be the kicker to A64FX and used in the Fugaku-Next systen, is this sentence: “Not only boosting traditional HPC workloads, but also providing high performance for AI & Data Analytical workloads.”
But here is the thing, which we point out often:HPC is about getting performance at any cost, and hyperscalers and cloud builders need to get the best reasonable performance at the lowest cost and lowest power.
These are very different design points, and while you can build HPC in the cloud, you can’t build a cloud optimized for running Web applications and expect it to do well on HPC simulation and modeling or even AI training workloads. And vice versa. An HPC cluster would not be optimized for low cost and low power and would be a bad choice for Web applications. You can sell real HPC systems under a cloud model, of course, by putting InfiniBand and fat nodes with lots of GPUs in 20 percent of the nodes in a cloud, but it is never going to be as cheap as the plain vanilla cloud infrastructure, which has that different design point.
With Fugaku-Next being a heterogeneous, “flow computer” style of supercomputer, it is very reasonable to think that a kicker to the Monaka Arm CPU aimed at cloud infrastructure could end up in the Fugaku-Next system. But that is not the same thing as saying there will not be a successor to A64FX, which researchers have already shown can have its performance boosted by 10X by 2028 with huge amounts of stacked L3 cache and process shrinks on the Arm cores. That is with no architectural improvements on the A64FX cores, and you know there will be tweaks here.
We think it is far more likely that a successor to Monaka, which we would expect in 2029 given a two year processor cadence, could be included in Fugaku-Next, but that there is very little chance it will be the sole CPU in the system – unless the economy tanks and MEXT and NEDO have to share money.
The Great Recession messed up the original “Keisuko” project, which had Fujitsu doing a scalar CPU, NEC doing a vector CPU, and Hitachi doing the torus interconnect we now know as Tofu. NEC and Fujitsu backed out because the project was too expensive and they did not think the technology could be commercialized enough to cover the costs. Fujitsu took over the project and delivered brilliantly, but we suspect that making money from Sparc64fx and A64FX has been difficult.
But, with government backing, as Fujitsu has thanks to its relationship with RIKEN, and Japan’s desire to be independent when it comes to its fastest supercomputer, none of that matters. What was true in 2009 about the value of supply chain independence (which many countries ignored for the sake of ease and lower cost supercomputers) is even more true in 2029.
Fujitsu is not being specific, and Satoshi Matsuoka, director of RIKEN Lab and a professor at Tokyo Institute of Technology, commented on the reports that Monaka was being used in Fugaku-Next machine in his Twitter feed thus: “Nothing has been decided yet whether Monaka will power #FugakuNEXT; it is certainly one of the technical elements under consideration.” But he also added this: “Since #HPC(w/AI, BD) is no longer a niche market, the point is not to create a singleton ***scale machine, but S&T platforms that will span across SCs, clouds etc. For that purpose, SW generality & market penetratability esp. to hyperscalars are must. We will partner w/vendors sharing the same vision.”
We think there will be two Arm CPUs used in Fugaku-Next: One keyed to AI inference and generic CPU workloads and one tuned to do really hard HPC simulation and AI training. Call them A64FX2 and Monaka2 if you want. The only way there will be one chip is if the budget compels it, just as happened with the K machine.
But, this is admittedly just speculation, and we will have to wait and see
It is most likely end of month book balancing for some large insto holder/s (this would not be retail selling), as we can see it ended up being a very large volume day. It is possibly an insto who still hasn't sold down (enough yet) after BRN was deleted from ASX200, also possible they had shares out on loan - hence reduction in shorted stock recently.

Dear Santa pleaseWell it’s December now - Sean I want my Christmas present early!
But seriously I do….
Revenue associated news please!
We got any dots with anyone through to Broadcom...would be nice
Broadcom Inc. | Connecting Everything
Broadcom Introduces Industry’s First Switch With On-Chip Neural Network
The New Trident 5-X12 Doubles Bandwidth, Reduces Power By 25%, and Adds Neural Network To Enable Next-Generation Telemetry, Security and Traffic Engineering
SAN JOSE, Calif., Nov. 30, 2023 (GLOBE NEWSWIRE) -- In a world’s first for switching silicon, Broadcom Inc. (NASDAQ:AVGO) today announced a novel on-chip, neural-network inference engine called NetGNT (Networking General-purpose Neural-network Traffic-analyzer) in its new, software-programmable Trident 5-X12 chip.
NoSorry for disjointed post, it's doing something weird when I try to copy and paste.
WorriesSorry for disjointed post, it's doing something weird when I try to copy and paste.