ASN CHART THREAD

BEISHA

Top 20
Hi All

1655544607910.png


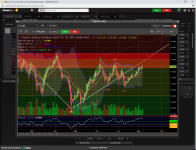
DOW lost another 1200 + pts for the week, has now hit the 38 fib ( 29785 ) level, a typical retracement for a sub wave 4 down as I have mentioned many times in the past, failure to hold there, we then have a pretty strong support zone just underneath, given the RSI 14 is sitting in double bottom OVER SOLD position, i really dont see too much more downside, unless it decides to go down as low as 17 ( red bubble ) when COVID hit in early 2020, even if it does go that low, still cant see the support zone breached to the downside......IMO

1655545049624.png

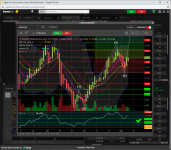
Whilst the DOW is still finding a bottom, conversely, GLOBAL X is looking BULLISH with higher highs / lows and the yellow arrow indicating minor sub wave 5 up is ready to go, which should penetrate that strong resistance highlighted in red, either next week, or by the start of the new trading year 1/7/22.

RSI 14 is perfectly placed just above 50.

This trend will give all lithium players a nice jolt in the arm of sentiment going forward.

1655545934385.png


Despite all the MACRO carnage, that strong support zone for ASN has not been breached to the down side, which is very encouraging, given that the DOW was only down 38 points on Friday night and the trend of the GLOBAL X is up, then I expect ASN to get a green start to next week and hopefully make in roads towards the strong resistance zone (12 / 14 ) by the end .

You will also notice that the RSI 14 support zone ( twin green lines ) hasnt been breached either, most Li players are bottom trough 29/30, but ASN at 43 is well positioned and primed to breach 54, the most likely explanation for this is the imminent FA regards to PARADOX expansion plus DFS which could re rate the coy.

tick tock.gif


Looking forward to that.

imo
 
  • Like
Reactions: 5 users

BEISHA

Top 20
Hi ALL

The week that was......

1656151551054.png

DOW had a pretty good week, nice bullish engulfing candle follow up after hitting the 38 fib strong support zone. ( yellow arrow )

Has the DOW reached a bottom ?

Well cant say that with any clarity yet, cause i have seen 2 prior engulfing candles in this ABC correction, but on both occasions were broken down and lower lows / highs were created.

What i am looking for is some higher lows / highs to develop, so in this case, looking for a retrace that creates a BULL FLAG pattern, then rise from there and start challenging the strong resistance zone.

1656152023810.png

The GLOBAL X is looking more bullish all the time...........this is what i want to see with the DOW chart.

Higher lows / highs, all the EMAs rising and the RSI 14 above 50..................BULLISH.

1656152334522.png

Given the positive MACRO for the week, was a little surprised to see the 10c support zone broken to the downside, ( yellow arrow ), that said, 61 fib retraces are common for sub wave 2 down but it didnt stay there for very long given the wick of the candle and rose rather sharply there after, so hopefully we have seen the low now and things start to improve, given the DOW was up 800 pts on Friday, you would like to think ASN SP can challenge and break that strong 50 fib resistance, (which was recently strong support) come this Monday.

Thats the theory , only MR MARKET will decide.

imo
 
  • Like
Reactions: 2 users

BEISHA

Top 20
Hi All

The week that was......

1656834102433.png

On the DAILY chart for ASN, minor sub wave 2 down hit the 61 fib ( 9.07 ) after a good rise from 8 - 10.5, so perfectly normal movement, i reckon we have seen the low now at 8c and minor sub wave 3 up is primed for lift off, i have plotted a path as to what i see coming , assuming news and MACRO is reasonably positive.

1656834827070.png

DOW chart starting to look a bit more postive, with higher lows / highs forming, minor sub wave 4 down looks to have found good support at the 61 fib and pushed off that zone with a 300 pt rise last Friday night, so we could be on the cusp of sub wave 5 up, which would be a real boost in sentiment for stocks in general after a complete flogging over the last few weeks / months.

1656835594561.png

Despite recent weakness with the GLOBAL X, overall trend is bullish, looks to have wicked off that good support at the 78 fib , so i expect the start of next week will be the next phase of sub wave 5 up ( mw3 up ) with another challenge to break down that strong resistance zone highlighted in red.

Should be a positive start to next week for ASN , given the emerging bullish trend of the MACRO, plus imminent update with the PARADOX.

imo
 
  • Like
Reactions: 2 users

Shivertown1

Emerged
Thanks for your time and effort Beisha,
 
  • Like
Reactions: 3 users

BEISHA

Top 20
Hi All

The week that was....

1657437387434.png

DOW had another positive week, up 233pts , minor sub wave 5 up looks on the move.

Yellow arrow pointing to the 5ema cross 20sma and not far away from converging with the 30 ema, so bullish so far.

RSI 14 just above 50 and primed to break clear.........bullish

1657437697310.png


Global X had a positive week too, looks like minor sub wave 2 down is done with minor sub wave 3 up to follow ( yellow arrow ), which should break that strong resistance zone highlighted in red either next week or the following.

5ema has crossed the 20sma and the 30ema.........bullish.

RSI 14 is above 50 and rising.........bullish

1657438347683.png


As a result of positive MACRO , positive news with Paradox plus imminent DFS, ASN SP is methodically going up, 5ema has crossed the 20sma and will converge with the 30 ema sometime next week......bullish

RSI 14 is above 50 and primed to break out......bullish.

I have adjusted minor sub wave 3 up target from 12c to 13, due to the HOURLY chart indicating one more leg up

1657439058852.png
This target should be executed next week.

robin hood tree target.gif


imo

Good luck all
 
  • Like
Reactions: 2 users

BEISHA

Top 20
Hi All

The week that was.....

1657953147566.png


Minor sub wave 3 up hit the 1.618 ( 13c ) target as mentioned in my last post, albeit briefly, a back test then followed to challenge the new support at 10.5c, ( minor sub wave 4 down ), now we are witnessing the early stages of minor sub wave 5 up, of which, i have a target of 16.94c to complete sub wave 1 up.

Classic Elliott wave formation currently for ASN based on strong FA developments , with plenty of good news to come regards to the PARADOX.


1657953593297.png

MACRO wise, DOW chart hit the 78 fib ( 30102 ) support level during the week, then had a very positive Friday night data result which culminated in a 600+ pt rise, me thinks that minor sub wave 5 up is on its way, which should provide good sentiment in the short term at least.

1657954265562.png

Global X chart

Looks like the ABC correction for minor sub wave 4 down is complete, with the commencement of minor sub wave 5 up taking place ( yellow arrow )

RSI 14 looks to have found support at 38.

Overall, MACRO is stabilising with a tinge of BULL and ASN is adopting the steady eddie approach.

Should be a green start for ASN next week, given the indicators at hand.

cross-finger-cross.gif


imo
 
  • Like
Reactions: 4 users

GT8 Sorpresa

Emerged
Thanks, Beisha. I would love to see this break 0.15 before the news drops.
 
  • Like
  • Love
Reactions: 3 users

BEISHA

Top 20
Thanks, Beisha. I would love to see this break 0.15 before the news drops.
Whats the next set of news ?

Jorc resource update ?

Then DFS ?

Or all encompassing ?

Either way, this is ASN time to shine.

Hoping for a nice rerate.

imo
 
  • Like
Reactions: 2 users

BEISHA

Top 20
Hi All

The week that was.......

1658640898385.png

Thought i would just provide an update with ASN not the MACRO..........pretty busy ATM.

If you refer to the red bubble, you can see that minor sub wave 3 up has double topped at the 61 fib level ( 13.57 ), 5 ema looks to b e sloping , with the RSI 14 indicator also sloping after getting close to 70 over bought level, consider also that the MACRO was weaker on Friday night, me thinks minor sub wave 4 down will back test to 12c, with minor sub wave 5 up to follow.

I think in my last post I had a target for the full 5 waves ( sub wave 1 up ) of 16.94, in retrospect, aligning the fib levels with the actual support and resistance lines, 16c is more realistic.......that said if the jorc resource upgrade news hits soonish, then that target could be a bit skinny.

Time will tell.

imo
 
  • Like
Reactions: 4 users

BEISHA

Top 20
Hi All

1659254786213.png

WEEKLY CHART ASN

I dont know if anyone has noticed, but i am taking more than a passing interest in HEIKEN ASHI candles of late, rather than the traditional candle sticks.........reason being, it smoothes out the noise.

Referring to the blue bubble, one of the characteristics of a strong trend with Heiken Ashi candles.... is the size of the candle, they overlap each other by half and dont display any bottom wicks.

So in this regard, ASN ticks all the boxes for a BULLISH trend so far.

You can also observe that SP is above the 9 & 18 ema...........tick

RSI 14 has plenty of room to move and is above 50.........tick

Plenty of room to move within the bollie bands too............tick

So if that pattern was continue, next week ASN should be in the 14c - 15c vicinity, then the following week, 15 - 16c.

Of course this theory could vary depending on the MACRO and the news factor.....;)

1659258721810.png

WEEKLY DOW CHART

SP has bounced off the 38 fib support nicely, but now has some head winds above, with the strong resistance zone impending.

9 ema turning up and RSI 14 lifting out of the oversold zone.........tick

1659258945466.png


GLOBAL X WEEKLY CHART

Virtually a carbon copy of the DOW chart with SP bouncing off the 38 fib support nicely, but now needs to navigate the strong resistance zone.

MACRO markets were all positive on Friday night, so ASN should be positive to start next week, but will it get a bit challenging later in the week ?

tick tock.gif


imo
 
  • Like
Reactions: 3 users

BEISHA

Top 20
Hi All

The week that was........

1659859490756.png


WEEKLY CHART ASN

ASN had a neutral week in terms of SP, there was an attempt to break the 23 fib ( 13.30 ) resistance but failed, i believe minor sub wave 4 down was activated meaning start of next week we should witness the commencement of minor sub wave 5 up.

The weekly chart is looking very bullish, with SP sitting right on top of the 9 & 18 ema and potentially we could see that converge with the 20sma next week.

RSI 14 above 50 and plenty of room to move within the bollie bands.

1659859696343.png

DAILY CHART ASN

Here you can see more clearly the minor sub wave 4 down movement for the week ( yellow arrow ), with the RSI 14 hitting the overbought 70 and back testing back to the 50 support line and then rising.

There is now good room to move now within the bollie bands too.

DAILY DOW CHART

1659860696548.png


SP is now in the early stages of minor sub wave 3 up , but has now reached the bottom of the strong resistance zone and as you can tell by the RHS blue bubble, its struggling to make in roads with 6 touches so far at the 32778 resistance line.........will there be a correction or will it push further up ?

1659861635701.png


DAILY GLOBAL X CHART

Same equation as per the DOW.............with some heavy lifting required to break that resistance zone, plenty of room within the bollie bands and the RSI 14 in which to achieve that goal.

Will it happen next week ?

Lets see if FOMO gathers some momentum next week as ASN gets closer to DFS news drop and we get into the 14 - 15c range.

Time will tell.

imo
 

Attachments

  • 1659861531558.png
    1659861531558.png
    250.1 KB · Views: 58
  • 1659846190449.png
    1659846190449.png
    231.2 KB · Views: 63
  • Like
Reactions: 3 users

Shivertown1

Emerged
Thanks Beisha
 
  • Like
Reactions: 1 users

BEISHA

Top 20
Hi All

1660458505779.png


ASN DAILY CHART

Yellow arrow pointing to a triple top at the 61 fib resistance, RSI 14 looks to be flatlining around the 70 over bought region, a couple of red flags that a short term correction is on the cards.

To complicate issues, DOW and Global X had really positive outcomes on Friday night...........:unsure:

So does ASN have more juice in the tank for another leg up ?

1660459006597.png

Or could a scenario like this occur next week in white ?

Time will tell.

imo
 
  • Like
Reactions: 3 users

FluffyQuack

Emerged
Getting a bit of caution from the cappers this week.

Whilst it is not a technical observation, seems that they too are all too aware that their time doing this is coming to an end at the current SP.
 
  • Thinking
Reactions: 1 users

BEISHA

Top 20
Getting a bit of caution from the cappers this week.

Whilst it is not a technical observation, seems that they too are all too aware that their time doing this is coming to an end at the current SP.
1660989772213.png


The cappers / bears are in control Fluffy ( yellow arrow ), sub wave 1 up is complete, now the inevitable sub wave 2 down, a bit of a guessing game where this retrace could go, but a common retrace for this movement is either 50/61 fib support, or somewhere in between.

The good news is, once this retrace is done, then sub wave 3 up follows, which is the longest , most powerful wave up in the 5 wave sequence, perfect platform in which to break that 16c resistance barrier , perfect timing too with the imminent DFS release....;)

1660990093955.png


The Dow has had a good run, but now it appears that minor sub wave 4 down is in motion, which is going to cause short term weakness for most stocks, including ASN.

1660991081858.png


Same situation as the DOW playing out with the Global X............;)

The way i look at, short term pain for long term gain.

I saw what was coming and sold some of my holdings at 15c, with the aim of adding it back in at a lower price, obtaining more leveredge for the DFS................whats your opinion as to when it might be released ?

I reckon it will be in September some time

imo
 

FluffyQuack

Emerged
View attachment 14552

The cappers / bears are in control Fluffy ( yellow arrow ), sub wave 1 up is complete, now the inevitable sub wave 2 down, a bit of a guessing game where this retrace could go, but a common retrace for this movement is either 50/61 fib support, or somewhere in between.

The good news is, once this retrace is done, then sub wave 3 up follows, which is the longest , most powerful wave up in the 5 wave sequence, perfect platform in which to break that 16c resistance barrier , perfect timing too with the imminent DFS release....;)

View attachment 14553

The Dow has had a good run, but now it appears that minor sub wave 4 down is in motion, which is going to cause short term weakness for most stocks, including ASN.

View attachment 14556

Same situation as the DOW playing out with the Global X............;)

The way i look at, short term pain for long term gain.

I saw what was coming and sold some of my holdings at 15c, with the aim of adding it back in at a lower price, obtaining more leveredge for the DFS................whats your opinion as to when it might be released ?

I reckon it will be in September some time

imo
I hope for your sake you added today Beisha...

Today saw the Shackles FINALLY being broken free. Whilst I'm not in your league of TA, just watching how the market depth played out today was a marvellous thing to see.

The cappers now know that the secret is out, and that ASN is starting to get alot more attention from big players...

What I love, is the fact that the SP has jumped a significant amount in one day, and this is prior to the DFS, or any off takes.

Edit: Some folks on HC were missing your company, hope you don't mind that I gave them a 'hint' of where to find you on a regular basis ;)
 
Last edited:
  • Like
  • Love
Reactions: 3 users

BEISHA

Top 20
I hope for your sake you added today Beisha...

Today saw the Shackles FINALLY being broken free. Whilst I'm not in your league of TA, just watching how the market depth played out today was a marvellous thing to see.

The cappers now know that the secret is out, and that ASN is starting to get alot more attention from big players...

What I love, is the fact that the SP has jumped a significant amount in one day, and this is prior to the DFS, or any off takes.

Edit: Some folks on HC were missing your company, hope you don't mind that I gave them a 'hint' of where to find you on a regular basis ;)
Hi Fluffy

Strong FA always trumps TA, .............always !!

What a fucking super announcement hey ?

With alot more good announcements to come...............ASN is finally breaking the shackles as you rightly say!

I only sold off 25% of holdings prior to todays announcement, so still had a nice wad of cash still in play.........sold a few more today as well.......;)

1661171055275.png

On a red macro day , with all lithium players in down turns, ASN bucked the trend........big time.

Does it have more to give ?

RSI 14 is 78.........very over bought.

Dow futures is down 300+ pts for tonite...........so not sure how tomorrow will play out......:unsure:

Regardless, this impressive FA / TA movement today, means that sub wave 2 down will probably finish around 14/15c, which is a great launching pad for further announcments and drive ASN into the 20, 30, 40c + region in the not so distant future.

Fluffy, i would really welcome my ole HC comrades to pay me a visit and talk about the exciting times ahead, you are welcome to copy and paste my charts and send to ASN HC too if you like .........

Until next time we chat.


IMO, IMO, IMO
 
  • Like
Reactions: 4 users

badger27

Emerged
Beisha, you’re very much loved and missed over at HC. My work makes it hard to maintain a presence in multiple chat rooms, but def know I’m always reading (usually while at airports) and very much appreciate your insights here.

Lots of great stuff to come for ASN. Exciting times.

Keen to hear your thoughts on the potential shooting star theory thrown around on HC yesterday, and whether it will likely push us down to fill the gap created on Thursday.

Personally, I’m keen to see that gap close before the next run of news. If I said that on HC, I would be crucified!! Just don’t want traders to have any reason to hold us back or push us down when more good news comes.

Hopefully we’re now in a spot where they don’t have enough shares to toy with the price so bloody much 🤞🤞
 
  • Like
Reactions: 3 users

BEISHA

Top 20
@badger27 , @GT8 Sorpresa , @Shivertown1 , @FluffyQuack

ASN WEEKLY CHART

1661592309702.png

2 ripper announcements in the one week, with 266m in volume, has propelled ASN to match all time highs and now we have a bona fide CUP & HANDLE pattern on our hands, with the handle now set to play out.

A combination of the RSI 14 weekly indicator over bought, SP miles above the upper bollie band ( blue arrow ) and with little in the way of support underneath until 15 - 18c region, my feelings is that is where minor sub wave 2 down will be complete.

DAILY CHART ASN

1661593333718.png

I started to sell off some of my holdings around the red bubble, as i was convinced that was the end of sub wave 1 up, but then we had a updated resource announcement , which pumped it up to the orange bubble , it was only after the bullish engulfing candle which followed the bearish engulfing candle in that same bubble, did i realise, that we had an all mighty minor sub wave 5 up on our hands.

The very next day i was ready to top up, but failed to to do so as ASN temporaily halted proceedings , then soon after announced the binding MOU with Sunresin to develop the Li processing plant...............BOOM!

So a bit peeved with a missed opportunity to make more money, but super delighted that ASN time to shine is happening alot earlier than expected......;)

ASN is a monster in waiting........

Yes Badger, the upper yellow arrow is pointing to a bearish shooting star candle.

I sold off another 50% of holdings at 27c as a result, with the aim to massively top up around 18c or lower.


1661595991061.png


Dow was down a whopping 1000pts on Friday night, ...........:eek:

So that gap with ASN chart will be filled early next week me thinks.........:unsure:

IMO
 
Last edited:
  • Like
Reactions: 2 users

badger27

Emerged
You’re a legend mate. Thankyou

We’re in an interesting period at the moment, where fundamentals and market anticipation (or FOMO) is having a pretty strong influence on things.

If we get a quick fire announcement or two, it’ll be hard NOT to call that gap at $0.225 a breakaway, but who knows - the market rarely forgets……

I’ve no doubt there’ll be another buying opportunity. I just feel more and more like it’ll happen once we’ve touched $0.50 or $0.60 - the dip will come after these awesome announcements drop and us LTH’s will be even more courageous and grab what we can, when we can.

Based on nothing but speculation and the patterns from other stocks. But ASN is well and truly it’s own beast now - plenty of surprises in store for us all!

Cheers again. Love your work 👍
 
  • Like
Reactions: 3 users
Top Bottom