BrainChip + Nanose


1650085042246.png

Before you release a video for world wide distribution to instruct people world wide in how to use a revolutionary system you would think you would check that you know the difference between suck and blow or exhale and inhale. 😂🤣🤪
My opinion only DYOR
FF

AKIDA BALLISTA
 
  • Like
  • Haha
Reactions: 7 users
D

Deleted member 118

Guest
A handheld device that can test for Covid in around 30 seconds, cost around $50 to manufacture, 90% accuracy. But still along way from approval plus it’s doesn’t use VOC

 
Last edited by a moderator:
  • Like
  • Thinking
  • Fire
Reactions: 7 users
Whenever the NaNose device comes to market for Covid testing at the stated original cost of $2 to $3 (see - Professor Haick) a test there will be an incredible amount of continuing demand world wide:

The Guardian

Explainer: why are Covid infection rates in Australia so high compared with other countries?​

Donna Lu - 5h ago

© Provided by The Guardian

1651890620962.png

As three new Omicron subvariants – BA.2.12.1, BA.4 and BA.5 – begin to spread in Australia, health authorities are warning of winter surges in both Covid and the flu.
Reported Covid infection rates in Australia are already among the highest in the world. As of data from 2 May, Australia’s average daily infection rate is 1,515 cases per million people – the second-highest in the world for countries with a population greater than 1 million, after New Zealand (1,566 cases per million).
On Wednesday, Western Australia recorded its highest-ever daily Covid figures with 9,782 cases.
Related: Seventeen cruise ship passengers isolating in Darwin after Covid outbreak
Despite its dominance in people’s lives and daily press coverage over the past two years, Australia’s response to the Covid pandemic has not featured prominently during the election campaign.
Why are reported infection rates in Australia so high compared with other countries – and despite sustained transmission of the virus, why do many now feel apathetic about Covid?

Why are there so many Covid cases in Australia?​

Prof Catherine Bennett, the chair in epidemiology at Deakin University, said Australia’s high reported infection rate may be the result of high “case ascertainment”.
Although PCR testing rates have dropped off in Australia, “we’re probably still doing it more so than anywhere else in the world”, Bennett said. “We still have free PCR testing. A lot of countries don’t.”
The number of confirmed Covid cases shouldn’t be relied on in isolation, Bennett said. “If you compare us to, say, the UK, they look much better for infection rates,” she said. “The UK’s confirmed case rate is 128 cases per million – less than a tenth of Australia’s 1,515 figure.
“Yet their hospitalisation rate per million is 209, and ours is 124. It suggests that they probably have twice as many [true] cases [as Australia].”
Prof Adrian Esterman, the chair of biostatistics at the University of South Australia, said the actual case numbers in Australia are still many times the number of reported cases.

“If we look at our PCR test positivity rates, they’re still very high,” he said. “In the whole of Australia … 20% of all PCR tests are coming out positive. It tells us that there is an awful lot of Covid that isn’t being diagnosed and we do require more testing – the World Health Organization wants that percentage to be less than 5%.”

Esterman believes the sustained high transmission is due to the removal of public health measures across the country. “It’s a ‘let it rip’ policy,” he said. “We’re getting more and more people reinfected.”

My opinion only DYOR
FF

AKIDA BALLISTA
 
  • Like
  • Fire
Reactions: 12 users

em1389

Member

Attachments

  • F0EA2C72-1EF6-4A7D-90F0-AA42705C1A8C.png
    F0EA2C72-1EF6-4A7D-90F0-AA42705C1A8C.png
    1.6 MB · Views: 127
  • Like
  • Fire
Reactions: 10 users

Zedjack33

Regular
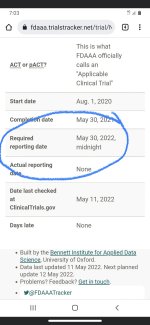
Reporting date. Fingers crossed.
 

Attachments

  • 14635C63-BDA2-4CCD-8046-A2B7E4A6049A.jpeg
    14635C63-BDA2-4CCD-8046-A2B7E4A6049A.jpeg
    437.8 KB · Views: 115
  • Like
  • Fire
  • Wow
Reactions: 20 users
D

Deleted member 118

Guest
6 hours overdue so nothing to look at here

BE760479-2386-460F-AE3B-E2E5A1731D1F.png
 
  • Like
  • Thinking
  • Sad
Reactions: 4 users
Interesting new article by co-authored by Hossam Haick. While you need permission to read it, it shows another interesting area where VOC detection and analysis could be used, predicting embryo quality

Non-Invasive Staging of In Vitro Mice Embryos by Means of Volatolomics​

  • Yasmin Shibli Abu Raya,
  • Yael Hershkovitz-Pollak,
  • Radu Ionescu*, and
  • Hossam Haick*

Abstract​

Current methods for embryo selection are limited. This study assessed a novel method for the prediction of embryo developmental potential based on the analysis of volatile organic compounds (VOCs) emitted by embryo samples. The study included mice embryos monitored during the pre-implantation period. Four developmental stages of the embryos were tested, covering the period from 1 to 4 days after fecundation. In each stage, the VOCs released by the embryos were collected and examined by employing two different volatolomic techniques, gas-chromatography coupled to mass-spectrometry (GC–MS) and a nanoarray of chemical gas sensors. The GC–MS study revealed that the VOC patterns emanating from embryo samples had statistically different values at different stages of embryo development. The sensor nanoarray was capable of classifying the developmental stages of the embryos. The proposed volatolomics analysis approach for embryos presents a promising potential for predicting their developmental stage. In combination with conventional morphokinetic parameters, it could be effective as a predictive model for detecting metabolic shifts that affect embryo quality before preimplantation.
 
  • Like
  • Fire
Reactions: 18 users

equanimous

Norse clairvoyant shapeshifter goddess
  • Like
  • Love
  • Thinking
Reactions: 9 users
for those that haven't read the study Akida is mention many times throughout this study in Jan, as well as The odor data acquired in the form of relative resistance signals was first visually analyzed using the PCNose tool, which is Sensigent’s interfacing and data acquisition software for the Cyranose-320™ e-nose system.

the question for me is where to go with a study like this and real world applications.... who is working on this now? to do what?
 
  • Like
Reactions: 6 users

TheFunkMachine

seeds have the potential to become trees.


Nanose getting some good exposure. It is stated in the video that the device is expected to be in the hands of people within 3 years.

The vision is for everyone in the world to have access to the device even in the remote parts of Africa.

It is also said that the goal is to be able to classify and detect every decease in the world. Big Vision
Akida everywhere
 

Attachments

  • DC42CF23-3B83-4E1E-ADDD-356680AF6D79.png
    DC42CF23-3B83-4E1E-ADDD-356680AF6D79.png
    5.4 MB · Views: 66
  • Like
  • Fire
  • Love
Reactions: 26 users
D

Deleted member 118

Guest
  • Like
Reactions: 1 users

Diogenese

Top 20
I've had some concerns about NaNose for some time.

The reported trial with Akida analysing the test results from the NaNose VOC detector showed of the order of 95% accuracy, if my recollection is correct.

However the figures which were submitted to Akida did not include all the test results from the NaNose VOC sensor.

A substantial portion of the NaNose results were excluded from the Akida analysis because the results were not within an acceptable range or some similar reason.

So is it possible that there are problems with the accuracy of the NaNose VOC detector?
 
  • Like
  • Sad
  • Fire
Reactions: 5 users
D

Deleted member 118

Guest
I've had some concerns about NaNose for some time.

The reported trial with Akida analysing the test results from the NaNose VOC detector showed of the order of 95% accuracy, if my recollection is correct.

However the figures which were submitted to Akida did not include all the test results from the NaNose VOC sensor.

A substantial portion of the NaNose results were excluded from the Akida analysis because the results were not within an acceptable range or some similar reason.

So is it possible that there are problems with the accuracy of the NaNose VOC detector?

I’ve always said this will be a NASA brainchild using Akida.
 
  • Like
Reactions: 3 users
D

Deleted member 118

Guest
 
  • Like
  • Love
  • Fire
Reactions: 6 users
D

Deleted member 118

Guest
Maybe not too long to wait


The data was analyzed by Brainchip with a Spiking Neural Network, the adjacent confusion matrix shows the results on the test set. The test set included 31 samples- 21 positives and 10 negatives from 21 tested subjects. Zero out of 21 positive samples were identified correctly which represents 100% sensitivity and 4 out of 10 negative samples were identified correctly which represents 40% specificity. The overall accuracy was 80.65% The second study was performed with the multiuse NaNose sensors installed in Sniffphone device. The dataset included 165 samples taken from 141 subjects tested with Sniffphone device at Zayed Military Hospital - 65 samples from 65 COVID-19 positive subjects and 100 samples from 76 COVID-19 negative subjects (Several negative subjects were sampled two or three times). A Linear discriminative analysis was performed. The adjacent confusion matrix shows the results on the test set that that was completely blind to the training and validation of the model. The test set included 37 samples - 8 positive and 29 negative samples from 27 tested subjects. Seven out of eight positive samples were identified correctly which represents 87.5% sensitivity, and 25 out of the 29 negative samples were identified correctly which represents 86.2% specificity. The overall accuracy was therefore 86.5%.
The same data set was analyzed also by the SNN methodology. To make the SNN most efficient, 34 samples were discarded due to noise or improper vector dimensionality. Thus, the dataset included 131 samples taken from 126 subjects tested with Sniffphone device at Zayed Military Hospital- 62 samples from 62 COVID-19 positive subjects and 69 samples from 64 COVID-19 negative subjects (Several negative subjects were sampled two or three times). The adjacent confusion matrix shows the results on the test set that that was completely blind to the training and validation of the model. The test set included 53 samples - 20 positive and 33 negative samples from 53 tested subjects. Nineteen out of 20 positive samples were identified correctly which represents 95% sensitivity and 29 out of 33 negative samples were identified correctly which represents 87.87 % specificity. The overall accuracy was therefore 90.5%.
Two different analysis methods were applied on the dataset and both showed excellent results for the differentiation between COVID positive and COVID negative. While the multiuse sensors achieved a much better specificity (-87%) compared to the single use sensors (40%), this is more likely a result of the vast difference between the datasets: the dataset of the multiuse sensors included 165 samples from 141 subjects while the dataset of the single-use sensors included 66 samples from 45 subjects. During the Clinical study with COVID19 patients the company further improved the 4 components of the device: the mechanical design including the breath collection mechanism, the electronics, the sensors and the classifying algorithm.
 
  • Like
Reactions: 12 users
D

Deleted member 118

Guest
I've had some concerns about NaNose for some time.

The reported trial with Akida analysing the test results from the NaNose VOC detector showed of the order of 95% accuracy, if my recollection is correct.

However the figures which were submitted to Akida did not include all the test results from the NaNose VOC sensor.

A substantial portion of the NaNose results were excluded from the Akida analysis because the results were not within an acceptable range or some similar reason.

So is it possible that there are problems with the accuracy of the NaNose VOC detector?
Looks like we were both wrong and things are now progressing nicely
 
  • Like
Reactions: 1 users

BaconLover

Founding Member
Maybe not too long to wait


The data was analyzed by Brainchip with a Spiking Neural Network, the adjacent confusion matrix shows the results on the test set. The test set included 31 samples- 21 positives and 10 negatives from 21 tested subjects. Zero out of 21 positive samples were identified correctly which represents 100% sensitivity and 4 out of 10 negative samples were identified correctly which represents 40% specificity. The overall accuracy was 80.65% The second study was performed with the multiuse NaNose sensors installed in Sniffphone device. The dataset included 165 samples taken from 141 subjects tested with Sniffphone device at Zayed Military Hospital - 65 samples from 65 COVID-19 positive subjects and 100 samples from 76 COVID-19 negative subjects (Several negative subjects were sampled two or three times). A Linear discriminative analysis was performed. The adjacent confusion matrix shows the results on the test set that that was completely blind to the training and validation of the model. The test set included 37 samples - 8 positive and 29 negative samples from 27 tested subjects. Seven out of eight positive samples were identified correctly which represents 87.5% sensitivity, and 25 out of the 29 negative samples were identified correctly which represents 86.2% specificity. The overall accuracy was therefore 86.5%.
The same data set was analyzed also by the SNN methodology. To make the SNN most efficient, 34 samples were discarded due to noise or improper vector dimensionality. Thus, the dataset included 131 samples taken from 126 subjects tested with Sniffphone device at Zayed Military Hospital- 62 samples from 62 COVID-19 positive subjects and 69 samples from 64 COVID-19 negative subjects (Several negative subjects were sampled two or three times). The adjacent confusion matrix shows the results on the test set that that was completely blind to the training and validation of the model. The test set included 53 samples - 20 positive and 33 negative samples from 53 tested subjects. Nineteen out of 20 positive samples were identified correctly which represents 95% sensitivity and 29 out of 33 negative samples were identified correctly which represents 87.87 % specificity. The overall accuracy was therefore 90.5%.
Two different analysis methods were applied on the dataset and both showed excellent results for the differentiation between COVID positive and COVID negative. While the multiuse sensors achieved a much better specificity (-87%) compared to the single use sensors (40%), this is more likely a result of the vast difference between the datasets: the dataset of the multiuse sensors included 165 samples from 141 subjects while the dataset of the single-use sensors included 66 samples from 45 subjects. During the Clinical study with COVID19 patients the company further improved the 4 components of the device: the mechanical design including the breath collection mechanism, the electronics, the sensors and the classifying algorithm.
I believe Covid train has left the station, hopefully they concentrate now on actual/real diseases rather than this sniffle.
Diagnosing Cancer in the early stages would be our Trump card and will save lives.
 
  • Like
  • Fire
  • Love
Reactions: 6 users
D

Deleted member 118

Guest
I believe Covid train has left the station, hopefully they concentrate now on actual/real diseases rather than this sniffle.
Diagnosing Cancer in the early stages would be our Trump card and will save lives.
Maybe not Covid, but this is probably the 1st step towards getting the device approved by the fda
 
  • Like
  • Fire
Reactions: 5 users
D

Deleted member 118

Guest
D

Deleted member 118

Guest
Yes, but I do have a few mates that ain’t and it’s knocked em for 6
 
  • Like
Reactions: 3 users
Top Bottom