LRS CHART THREAD

BEISHA

Top 20
Hi All

View attachment 8511
DOW down 260 pts for the week, with the yellow arrow suggesting either sub wave 2 down or something a bit more sinister, like a BULL TRAP and an extended ABC correction to the 38 fib whereby alot of sub wave 4 downs ( white ), gravitate.......time will tell.

View attachment 8512

Global X is looking good for a SWING up, needs to break that strong resistance zone in red to confirm.

RSI 14 also needs to get above 50.

View attachment 8513

A look at the DAILY chart, confirms my bullish statement, with higher highs / lows, RSI 14 above 50 and not over bought, and all the moving averages on the rise, including 20sma and upper bollie.

Once the swing up is confirmed, it will be bullish for all LI players, including LRS.


LRS chart still bullish despite the bearish MACRO, long term trend is still there, SP still perfectly aligned with ELLIOTT WAVE ( wave 4 down not entering wave 1 up territory ) that said, DOW was down 200+ pts on Friday night, so my question is, will there be a push to FILL THE GAP ( blue shade ) start of next week ?

Time will tell.

DORY the DUNCE at the crapper thinking 5c is the next drop.......................CRAPPOLA !! ( lol,lol,lol,lol )

The fact of the matter, is LRS would never have dropped this low in the first place if it wasnt for the BEARISH MACRO......anyone can predict DOOM in that scenario.

Even the ripper announcement last thursday with the lovely visuals , got treated with contempt.......:eek:

Picking bottoms is tough, but if the GAP closes at 7.8c, then I would be confident thats the floor.

Time will tell.

View attachment 8520

imo
Hi All

Just noticed i hadnt posted the LRS chart ..............my bad.

1654599139824.png

The blue shaded area is the GAP, it looks as tho Mr Market wants to fill that whilst MACRO is still bearish, you can see the long term trend is still there, sub wave 4 down is still aligned with the heights of sub wave 1 up, ( if you discount the wick ), once that gap gets filled then it sits on top of a fairly strong support zone, so hopefully that will be the bottom, worst case scenario, it hits 6 cents, that would be ultra crazy considering the FA and a wonderful opportunity to take advantage.....which I will.

imo
 

BEISHA

Top 20
Hi All

Just noticed i hadnt posted the LRS chart ..............my bad.

View attachment 8709
The blue shaded area is the GAP, it looks as tho Mr Market wants to fill that whilst MACRO is still bearish, you can see the long term trend is still there, sub wave 4 down is still aligned with the heights of sub wave 1 up, ( if you discount the wick ), once that gap gets filled then it sits on top of a fairly strong support zone, so hopefully that will be the bottom, worst case scenario, it hits 6 cents, that would be ultra crazy considering the FA and a wonderful opportunity to take advantage.....which I will.

imo
1654772295031.png

Well, GAP ( blue shaded area ) well and truly FILLED now, SP poking its nose in the STRONG SUPPORT ZONE, I would like to think it might reverse here, that white line represents minor support within the support zone, if bearish MACRO persists then that could get hit, with 6c being the maximum downside i feel, I picked up some at 7.4 today and will keep buying from here down if necessary, too good an opportunity not to.

Dow futures up 150+ on last look, so there might be a bit of relief come tomorrow.

Wait and see.

imo
 

BEISHA

Top 20
Hi All

The week that was..........

1655007565668.png

Another brutal week for the DOW, with a near on 1700 pt drop , including a 880pt drop on Friday night, currently SP is sitting on some minor support , if it fails to hold there, then there is some more support at 31000, then the STRONG SUPPORT ZONE comes to the frame, whereby the 38 fib lies, just above the height of sub wave 1 up , where i have alluded for some time the SP could reverse, worst case, it could hit the bottom of the support zone at 28675...........not sure it will go that low given the RSI 14 indicator is close to the OVER SOLD zone at 29.

So amongst the doom and gloom, there could be some green shoots arriving in the next week or so, coinciding with the end of that " Sell in May and go away " tax selling period.

1655009354243.png

Whilst the DOW is still in a down trend, the GLOBAL X is not far away from a SWING, needs to get thru that strong resistance zone highlighted in red, once that is achieved, then all lithium players will get a boost in sentiment.

RSI 14 needs to get above 50 ( green line ) in which to achieve that .

1655009746653.png

Instead of showing a WEEKLY chart of LRS, i think the daily chart reveals alot more, as mentioned in the last post, GAP ( blue shaded area ) has been filled and has now entered the strong support zone, you will notice in the red bubble that a DOJI has presented itself after hitting minor support at 6.7, could this be a signal of a reversal ?

With the DOW down 880 pts on Friday, its hard to tell how LRS will respond on Tuesday, especially if the DOW shows more weakness on Monday night, but given that the RSI 14 looks to be flattening out at over sold 30 and given the previous time it hit that level ( yellow bubbles ), surely there cant be too much down side from here ?

I bought some more at 7.2 and if it drops further, i will just continue to accumulate.

A gift that keeps on giving considering the STRONG FA at Salinas and CLOUD 9.

These prices will be a long distat memory come EOY.

robin hood image.gif

imo
 
  • Like
Reactions: 2 users

lellep

Regular
Hi All

The week that was..........

View attachment 9096
Another brutal week for the DOW, with a near on 1700 pt drop , including a 880pt drop on Friday night, currently SP is sitting on some minor support , if it fails to hold there, then there is some more support at 31000, then the STRONG SUPPORT ZONE comes to the frame, whereby the 38 fib lies, just above the height of sub wave 1 up , where i have alluded for some time the SP could reverse, worst case, it could hit the bottom of the support zone at 28675...........not sure it will go that low given the RSI 14 indicator is close to the OVER SOLD zone at 29.

So amongst the doom and gloom, there could be some green shoots arriving in the next week or so, coinciding with the end of that " Sell in May and go away " tax selling period.

View attachment 9103
Whilst the DOW is still in a down trend, the GLOBAL X is not far away from a SWING, needs to get thru that strong resistance zone highlighted in red, once that is achieved, then all lithium players will get a boost in sentiment.

RSI 14 needs to get above 50 ( green line ) in which to achieve that .

View attachment 9106
Instead of showing a WEEKLY chart of LRS, i think the daily chart reveals alot more, as mentioned in the last post, GAP ( blue shaded area ) has been filled and has now entered the strong support zone, you will notice in the red bubble that a DOJI has presented itself after hitting minor support at 6.7, could this be a signal of a reversal ?

With the DOW down 880 pts on Friday, its hard to tell how LRS will respond on Tuesday, especially if the DOW shows more weakness on Monday night, but given that the RSI 14 looks to be flattening out at over sold 30 and given the previous time it hit that level ( yellow bubbles ), surely there cant be too much down side from here ?

I bought some more at 7.2 and if it drops further, i will just continue to accumulate.

A gift that keeps on giving considering the STRONG FA at Salinas and CLOUD 9.

These prices will be a long distat memory come EOY.

View attachment 9107
imo
Hello, would you say LRS is a buy now or would you wait until the DOW and LIT X hits the support and shows a reversal?

//
Lellep
 

BEISHA

Top 20
Hello, would you say LRS is a buy now or would you wait until the DOW and LIT X hits the support and shows a reversal?

//
Lellep
LRS is extremely cheap right now, but the expected rate hike tonite could make it cheaper again, i would wait a bit longer, there might be a chance it goes into the mid / high 5c region, then i would be accumulating from there, cant go wrong if you have a long term vision.

Remember, they have hit high grade lithium and they have a big drilling campaign under way , further results may not be too far away.

Just my 2c opinion.

BTW, i havnt forgotton your PM, will get back to you soon.
 
  • Love
  • Like
Reactions: 2 users

lellep

Regular
LRS is extremely cheap right now, but the expected rate hike tonite could make it cheaper again, i would wait a bit longer, there might be a chance it goes into the mid / high 5c region, then i would be accumulating from there, cant go wrong if you have a long term vision.

Remember, they have hit high grade lithium and they have a big drilling campaign under way , further results may not be too far away.

Just my 2c opinion.

BTW, i havnt forgotton your PM, will get back to you soon.
Thanks Beisha, all good! No need to stress.
//
Lellep
 
  • Like
Reactions: 1 users

BEISHA

Top 20
Hi All

The week that was......

1655549069676.png


DOW has now reached the 38 fib support at (29785 ), a typical retracement for sub wave 4 down, now the question remains, is that the floor or does it hit the top of the strong support zone, aligning with the height of sub wave 1 up, which means perfect alignment regards to EW ?

Given the RSI 14 is now double bottom OVER SOLD , cant be much down side to go, even if it went as low as 17 ( red bubble ), still dont see the support zone being broken.....imo.

1655549527204.png
Whilst the DOW is still searching for a bottom to be confirmed, the GLOBAL X is looking rather BULLISH, the DAILY chart tells the best story, higher highs / lows, with the RSI 14 perfectly placed to clear break that all important 50 line .

Yellow arrow suggesting minor sub wave 5 up is set to go with HEIKEN ASHI candles turning green and sitting high up from the previous long red candle.

This trend will give all lithium players a nice jolt in the arm with sentiment, including LRS.

1655552175267.png


Looking at the LRS chart, that strong support zone is holding up well, despite the MACRO fallout, yellow arrow pointing to a spin top doji candle , a possible reversal on the cards.

RSI 14 looks to be flattening out , just shy of the 50 line , another promising sign that further downside is going to be limited, given that the DOW only dropped 38 points on Friday night and the Global X is becoming more bullish, i expect SP to have a green start come Monday, i am hoping also by the end of next week that the SP will be get out of the green zone and perhaps fill the GAP ( shaded blue ) and in the process, RSI 14 gets above 50.

That all assumes that the MACRO stabilizes and improves somewhat.

We shall see.

imo
 

BEISHA

Top 20
Hi All

The week that was......

1656158083762.png

Dow had a great week, up 1400pts coming off that 38 fib zone , producing a lovely green bullish engulfing candle

Is the bottom in ?

Cant tell yet, need to see some higher highs /lows forming, need to see that RSI 14 indicator get above 50.

More will be revealed next week.

1656158390313.png

The Global X chart is performing what i want to see the DOW chart do, higher highs / lows, all the emas rising and RSI 14 above 50.

This is a classic EW chart in the making here.............BULLISH

1656158613197.png

Rather than showing the WEEKLY chart of LRS, its more beneficial to show the DAILY chart instead.

Blue bubble displaying nice accumulation at the lower half of the strong support zone and showing signs of pushing off.

RSI 14 is curving up and the 5ema looks like its flattening out nicely too, with a bit of extra volume to add to the mix.

Given the MACRO is on the improve, LRS SP should get a green start to the week, if some positive FA news was to drop regards to Salinas , there could be a chance the GAP could get filled ( blue rectangle shaded area ).

News update cant be far away.

We shall see.

robin hood tree target.gif


imo
 
  • Love
Reactions: 1 users

lellep

Regular
Hi All

The week that was......

View attachment 10147
Dow had a great week, up 1400pts coming off that 38 fib zone , producing a lovely green bullish engulfing candle

Is the bottom in ?

Cant tell yet, need to see some higher highs /lows forming, need to see that RSI 14 indicator get above 50.

More will be revealed next week.

View attachment 10149
The Global X chart is performing what i want to see the DOW chart do, higher highs / lows, all the emas rising and RSI 14 above 50.

This is a classic EW chart in the making here.............BULLISH

View attachment 10150
Rather than showing the WEEKLY chart of LRS, its more beneficial to show the DAILY chart instead.

Blue bubble displaying nice accumulation at the lower half of the strong support zone and showing signs of pushing off.

RSI 14 is curving up and the 5ema looks like its flattening out nicely too, with a bit of extra volume to add to the mix.

Given the MACRO is on the improve, LRS SP should get a green start to the week, if some positive FA news was to drop regards to Salinas , there could be a chance the GAP could get filled ( blue rectangle shaded area ).

News update cant be far away.

We shall see.

View attachment 10151

imo
Thank you Beisha, very good analysis as usual. Thank you for your input!

//
Lellep
 
  • Like
Reactions: 1 users

BEISHA

Top 20
Hi All

1656831022939.png

Looks to me LRS has found the bottom at 5.8c and good accumulation is taking place before minor sub wave 3 up takes off, which i have a target of 9.17 or thereabouts.

5 ema flattening out, so too RSI 14, plenty of room to move up considering its just above the over sold zone.

1656831622246.png

Dow chart is encouraging , some nice higher lows / highs forming , SP bounced off that 61 fib support nicely, so could sub wave 5 up be on the way ?

RSI 14 looks primed to break out from the green zone which would be bullish

1656832851220.png

Global X long term trend is still intact, despite the recent weakness, this kind of movement is all part of the process of sub wave 5 up, SP wicked off the strong 78 fib support line, i expect that strong resistance zone in red to get challenged once again starting next week.....which will provide good sentiment for all lithium players.

imo
 

BEISHA

Top 20
Hi All

1657443548996.png

Thought i would provide an hourly chart to illustrate how bullish LRS has been since hitting the 5.8c low

The light blue border outline represents a ascending triangle formation and SP is primed to break out of that next week and get into the 8c range hopefully.

All the emas are rising......5/30/50, 20sma and upper bollie too.......bullish

RSI 14 perfectly placed just above 50.

I have a sub wave 3 up target of 8.7c

1657443810149.png


Dow looking alot better since hitting the 29600 lo, with minor sub wave 5 up on its way.

1657443996116.png


Global X getting more bullish all the time too, that strong resistance zone highlighted in red looks like it could be broken to the upside in the next week or so.

Overall, MACRO sentiment is good, LRS chart looking bullish and more news from Salinas cant be far away.

STRONG HOLD / BUY

imo
 

BEISHA

Top 20
Hi All

1657956539949.png


Unfortunately my minor sub wave 3 up target fell short of the anticipated 8.7c range, mainly due to the continued weakness on the MACRO side of things......shit happens.

Short term trend is still bullish, with strong support at 6.5c confirmed with minor sub wave 4 down complete, with the first steps of minor sub wave 5 up taking place.

I have a target of 9.43c to complete a full set of 5 waves to form sub wave 1 up, with an ABC correction to follow.

Need decent news at Salinas drilling campaign to achieve that target, hopefully assay results due soon.

MACRO wise.....

1657957412438.png


DOW CHART

Minor sub wave 4 down looks complete, hitting the 78 fib support , with a positive data result on Friday night giving a nice uplift, so hopefullu minor sub wave 5 up is on its way.

RSI 14 looking slightly bullish, finding support at 38 and rising, needs to get above 50 to continue the short term trend up.

1657958269849.png


GLOBAL X CHART.

Same scenario as the DOW, with minor sub wave 4 down looking complete, with minor sub wave 5 up to follow.

Sentiment is on the improve, so a positive start to next week should be on the cards for LRS going by these positive indicators.


cross-finger-cross.gif


imo
 
  • Love
Reactions: 1 users

lellep

Regular
Hi All

View attachment 11565

Unfortunately my minor sub wave 3 up target fell short of the anticipated 8.7c range, mainly due to the continued weakness on the MACRO side of things......shit happens.

Short term trend is still bullish, with strong support at 6.5c confirmed with minor sub wave 4 down complete, with the first steps of minor sub wave 5 up taking place.

I have a target of 9.43c to complete a full set of 5 waves to form sub wave 1 up, with an ABC correction to follow.

Need decent news at Salinas drilling campaign to achieve that target, hopefully assay results due soon.

MACRO wise.....

View attachment 11566

DOW CHART

Minor sub wave 4 down looks complete, hitting the 78 fib support , with a positive data result on Friday night giving a nice uplift, so hopefullu minor sub wave 5 up is on its way.

RSI 14 looking slightly bullish, finding support at 38 and rising, needs to get above 50 to continue the short term trend up.

View attachment 11567

GLOBAL X CHART.

Same scenario as the DOW, with minor sub wave 4 down looking complete, with minor sub wave 5 up to follow.

Sentiment is on the improve, so a positive start to next week should be on the cards for LRS going by these positive indicators.


View attachment 11568


imo
Thanks Beisha, very keen for more great news from LRS!

//
Lellep
 
  • Like
Reactions: 1 users

Bernster

Emerged
Thanks Beisha, very keen for more great news from LRS!

//
Lellep
Ama
Hi All

View attachment 11565

Unfortunately my minor sub wave 3 up target fell short of the anticipated 8.7c range, mainly due to the continued weakness on the MACRO side of things......shit happens.

Short term trend is still bullish, with strong support at 6.5c confirmed with minor sub wave 4 down complete, with the first steps of minor sub wave 5 up taking place.

I have a target of 9.43c to complete a full set of 5 waves to form sub wave 1 up, with an ABC correction to follow.

Need decent news at Salinas drilling campaign to achieve that target, hopefully assay results due soon.

MACRO wise.....

View attachment 11566

DOW CHART

Minor sub wave 4 down looks complete, hitting the 78 fib support , with a positive data result on Friday night giving a nice uplift, so hopefullu minor sub wave 5 up is on its way.

RSI 14 looking slightly bullish, finding support at 38 and rising, needs to get above 50 to continue the short term trend up.

View attachment 11567

GLOBAL X CHART.

Same scenario as the DOW, with minor sub wave 4 down looking complete, with minor sub wave 5 up to follow.

Sentiment is on the improve, so a positive start to next week should be on the cards for LRS going by these positive indicators.


View attachment 11568


imo
Thats some impressive charting BTW - LRS target of 0.087 touched. I think next week we will see this push into the 9's.
Personally Ive been picking up the options from 5.8 to 6.2. That was me snapping them all up.
Bernie
 
  • Like
Reactions: 1 users

BEISHA

Top 20
Hi All

1658645065006.png

Minor sub wave 3 up looks to have peaked at my target of 8.7c after all, (got my wave count wrong last week , now adjusted ), so now minor sub wave 4 down ABC appears to be following suit.

As a general rule, wave 4 downs are reasonably shallow, they generally back test to the 38 fib level, or the heights of wave 1 up or just under, so a retrace to 7.55 or 7.19 or somewhere in between is the likely movement, then minor sub wave 5 up to follow suit.

Macro markets were weaker on Friday night, so that should expedite minor sub wave 4 down for LRS come Monday.

imo
 
Last edited:

BEISHA

Top 20
Hi All

View attachment 12350
Minor sub wave 3 up looks to have peaked at my target of 8.7c after all, (got my wave count wrong last week , now adjusted ), so now minor sub wave 4 down ABC appears to be following suit.

As a general rule, wave 4 downs are reasonably shallow, they generally back test to the 38 fib level, or the heights of wave 1 up or just under, so a retrace to 7.55 or 7.19 or somewhere in between is the likely movement, then minor sub wave 5 up to follow suit.

Macro markets were weaker on Friday night, so that should expedite minor sub wave 4 down for LRS come Monday.

imo
1659588013258.png


As predicted , minor sub wave 4 down back tested from 8.7 and finished just under the minor sub wave 1 height, yellow arrow pointing to a doji, which hopefully is the signal for minor sub wave 5 up to be activated.

I have a target of around 11c for this movement, whereby i will take some profit before ABC takes place there after.

imo
 

gex

Regular
so... that was fun
 
  • Like
Reactions: 1 users

BEISHA

Top 20
so... that was fun
Hi Gex

Yes, yesterday was awesome, nice price action and great volume.....(y)

1660023154094.png


However, looks to me like like a full set of 5 waves has been complete, hit my 10/11c target , now for a ABC correction to follow if that long red candle with above average volume is anything to go by.

RSI 14 hit the 70 over bought level and now bending over.

Wave 2 down corrections normally attract the 50 / 61 fib levels, so either 8.34 / 7.70.

I sold 70% of holdings around the 9.8 / 10c level, retained the rest in case of a FA news drop, will pile the rest back in once it finds a base .

imo
 

Attachments

  • 1660023011311.png
    1660023011311.png
    199.4 KB · Views: 52

BEISHA

Top 20
Hi Gex

Yes, yesterday was awesome, nice price action and great volume.....(y)

View attachment 13715

However, looks to me like like a full set of 5 waves has been complete, hit my 10/11c target , now for a ABC correction to follow if that long red candle with above average volume is anything to go by.

RSI 14 hit the 70 over bought level and now bending over.

Wave 2 down corrections normally attract the 50 / 61 fib levels, so either 8.34 / 7.70.

I sold 70% of holdings around the 9.8 / 10c level, retained the rest in case of a FA news drop, will pile the rest back in once it finds a base .

imo
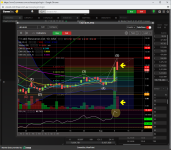
1660464753219.png

LRS HOURLY CHART

This hourly chart looks to support my argument that 11.5c is the high point for this current run in a bit more detail.

Divergence with the RSI 14 indicator another red flag too

What will be interesting is how LRS responds tomorrow with the DOW up 400pts on Friday , plus Global X up too.

See what happens.

imo
 
  • Like
Reactions: 1 users

Costi

Member
Any update Beisha? Broke 11.5 up to 12 but closed back at 11.5
 
  • Like
Reactions: 1 users
Top Bottom